
Near-Field Scanning Optical Microscopy
Introduction
A fundamental principle in diffraction-limited optical microscopy requires that the spatial resolution of an image is limited by the wavelength of the incident light and by the numerical apertures of the condenser and objective lens systems. The development of near-field scanning optical microscopy (NSOM), also frequently termed scanning near-field optical microscopy (SNOM), has been driven by the need for an imaging technique that retains the various contrast mechanisms afforded by optical microscopy methods while attaining spatial resolution beyond the classical optical diffraction limit.
Near-field scanning optical microscopy is classified among a much broader instrumental group referred to generally as scanning probe microscopes (SPMs). All SPMs owe their existence to the development of the scanning tunneling microscope (STM), which was invented by IBM research scientists Gerd Binnig and Heinrich Rohrer in the early 1980s.
The theoretical resolution limit of conventional optical imaging methodology (200 to 300 nanometers for visible light) was the primary factor motivating the development of recent higher-resolution scanning probe techniques, such as STM and atomic force microscopy (AFM), and previously, transmission electron microscopy (TEM) and scanning electron microscopy (SEM). These and related techniques have enabled phenomenal gains in resolution, even to the level of visualizing individual atoms. However, prior to the development of near-field scanning optical methods, the superior resolution capabilities have come at the expense of the wide variety of contrast-enhancing mechanisms available to optical microscopy. Furthermore, the extreme specimen preparation requirements for most of the high-resolution methods have limited their application in many areas of study, particularly in biological investigations involving dynamic or in vitro measurements. The method of near-field scanning optical microscopy combines the extremely high topographic resolution of techniques such as AFM with the significant temporal resolution, polarization characteristics, spectroscopic capabilities, sensitivity, and flexibility inherent in many forms of optical microscopy.
The interaction of light with an object, such as a microscope specimen, results in the generation of both near-field and far-field light components. The far-field light propagates through space in an unconfined manner and is the "normal" light utilized in conventional microscopy. The near-field (or evanescent) light consists of a nonpropagating field that exists near the surface of an object at distances less than a single wavelength of light. Light in the near-field carries more high-frequency information and has its greatest amplitude in the region within the first few tens of nanometers of the specimen surface. Because the near-field light decays exponentially within a distance less than the wavelength of the light, it usually goes undetected. In effect, as the light propagates away from the surface into the far-field region, the highest-frequency spatial information is filtered out, and the well known diffraction-based Abbe limit on resolution is imposed. By detecting and utilizing the near-field light before it undergoes diffraction, the NSOM makes available the full gamut of far-field optical contrast-enhancing mechanisms at much higher spatial resolution. In addition to non-diffraction-limited high-resolution optical imaging, near-field optical techniques can be applied to chemical and structural characterization through spectroscopic analysis at resolutions beneath 100 nanometers.
The most recent commercial NSOM instruments combine the scanning force techniques of an AFM with the optical detection capabilities of conventional optical microscopy. The overall NSOM design can vary significantly, depending upon the requirements of the particular research project. One of the most common configurations is to incorporate the NSOM into an inverted fluorescence microscope. By basing the NSOM on a conventional optical instrument, many of the microscopist's familiar optical imaging modes are available in combination with near-field high-resolution capabilities. In addition to the optical information, NSOM can generate topographical or force data from the specimen in the same manner as the atomic force microscope. The two separate data sets (optical and topographical) can then be compared to determine the correlation between the physical structures and the optical contrast. The real power of the NSOM technique may rest in this unique capability of combining a topographical data set with a variety of corresponding optical data at resolutions far better than is possible under the diffraction limitations of focused light.
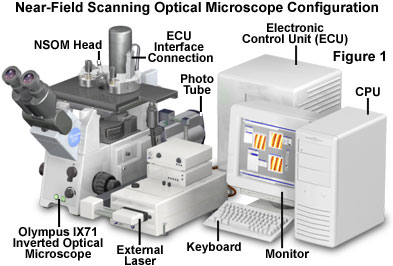
Presented in Figure 1 is a near-field scanning instrument configured around a modern inverted optical microscope. Such an arrangement conveniently allows the NSOM head, incorporating the probe and its positioning mechanism, to be mounted at the specimen stage location, with the objective positioned beneath the stage. The system illustrated in the figure includes an external laser to provide illumination, a photomultiplier detector for optical signal collection, and a computer and electronic control unit for management of specimen and probe positioning and image acquisition.
Although the scanning probe microscope family encompasses a vast array of specialized and highly varied instruments, their common operational motif is the employment of a local probe in close interaction with the specimen. A typical SPM local probe is equipped with a nanometer-sized tip whose tip-to-specimen interactions can be sensed and recorded by a variety of mechanisms. Each different type of SPM is characterized by specific properties of the local probe and the nature of its interaction with the specimen surface.
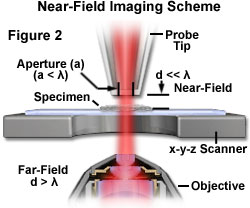
A representation of the typical NSOM imaging scheme is presented in Figure 2, in which an illuminating probe aperture having a diameter less than the wavelength of light is maintained in the near field of the specimen surface. Because close proximity or contact between the specimen and probe (separation less than the wavelength) is a general requirement for non-diffraction-limited resolution, the vast majority of all SPMs require a feedback system that precisely controls the physical separation of the probe and specimen. In addition, an x-y-z scanner (usually piezoelectric) is utilized to control the movement of the probe over the specimen. The NSOM configuration illustrated in Figure 2 positions the objective in the far field, in the conventional manner, for collection of the image-forming optical signal.
Depending upon the design of the particular instrument, the x-y-z scanner can either be attached to the specimen or to the local probe. If the scanner and specimen are coupled, then the specimen moves under the fixed probe tip in a raster pattern to generate an image from the signal produced by the tip-specimen interaction. The size of the area imaged is dependent only on the maximum displacement that the scanner can produce. A computer simultaneously evaluates the probe position, incorporating data obtained from the feedback system, and controls the scanning of the tip (or specimen) and the separation of the tip and specimen surface. The information generated as a result of sensing the interaction between the probe and specimen is collected and recorded by the computer point-by-point during the raster movement. The computer then renders this data into two-dimensional data sets (lines).
Two-dimensional data sets gathered by the NSOM instrument are subsequently compiled and displayed as a three-dimensional reconstruction on a computer monitor. The typical size scale of features measured with a scanning probe microscope ranges from the atomic level (less than 1 nanometer) to more than 100 micrometers. The scanning probe microscopy family includes modalities based on magnetic force, electrical force, electrochemical interactions, mechanical interactions, capacitance, ion conductance, Hall coefficient, thermal properties, and optical properties (NSOM, for example). NSOM images are typically generated by scanning a sub-wavelength aperture over the specimen in a two-dimensional raster pattern and collecting the emitted radiation in the optical far-field, point-by-point.
| Interactive Java Tutorial | |||||||||||
|
|||||||||||
Previously developed high-resolution techniques, such as scanning electron microscopy, transmission electron microscopy, scanning tunneling microscopy, and atomic force microscopy, do not benefit from the wide array of contrast mechanisms available to optical microscopy, and in most cases, are limited to the study of specimen surfaces only. Aside from the available contrast-enhancing techniques of staining, fluorescence, polarization, phase contrast, and differential interference contrast, optical methods have inherent spectroscopic and temporal resolution capabilities.
The high-resolution afforded by electron microscopy techniques is achieved at the cost of greater limitations on acceptable specimen types and increased demands of sample preparation, including vacuum compatibility requirements, preparation of thin sections for transmission microscopy, and generally, the application of a conductive coating for non-conducting specimens (STM also has this requirement). For biological materials, specimen preparation is especially demanding, as complete dehydration is generally required prior to carrying out sectioning or coating. Although atomic force microscopy is free from many of these specimen preparation considerations, and can be applied to study specimens near the atomic level in ambient conditions, the method does not readily provide spectroscopic information from the specimen. An additional limitation is that AFM is not able to take advantage of the wide array of reporter dyes available to fluorescence microscopy.

The NSOM method is particularly useful to nano-technologists (physicists, materials scientists, chemists, and biologists) who require ultra-high resolution spatial information from the broad range of materials encountered in their varied disciplines. Although newer near-field instrumentation techniques are being developed to image three-dimensional volume sets, NSOM has typically been limited to specimens that are accessible by a local probe, which is physically attached to a macroscopic scan head.
A schematic illustrating the control and information flow of an inverted optical microscope-based NSOM system is presented in Figure 3. The laser excitation source is coupled into a fiber optic probe for specimen illumination, with the probe tip movement being monitored through an optical feedback loop incorporating a second laser focused on the tip. The motion of the probe tip, translational stage movement, and acquisition and display of optical and topographic (or other force) images is controlled through additional electronics and the system computer.
History of NSOM
Edward H. Synge, beginning in 1928, published a series of articles that first conceptualized the idea of an ultra-high resolution optical microscope. Synge's proposal suggested a new type of optical microscope that would bypass the diffraction limit, but required fabrication of a 10-nanometer aperture (much smaller than the light wavelength) in an opaque screen. A stained and embedded specimen would be ground optically flat and scanned in close proximity to the aperture. While scanning, light illuminating one side of the screen and passing through the aperture would be confined by the dimensions of the aperture, and could be used to illuminate the specimen before undergoing diffraction. As long as the specimen remained within a distance less than the aperture diameter, an image with a resolution of 10 nanometers could be generated. In addition, Synge accurately outlined a number of the technical difficulties that building a near-field microscope would present. Included in these were the challenges of fabricating the minute aperture, achieving a sufficiently intense light source, specimen positioning at the nanometer scale, and maintaining the aperture in close proximity to the specimen. The proposal, although visionary and simple in concept, was far beyond the technical capabilities of the time.
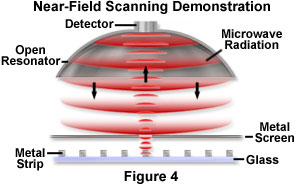
Experimental verification of the feasibility of Synge's proposals had to wait until 1972 when E. A. Ash and G. Nicholls demonstrated the near-field resolution of a sub-wavelength aperture scanning microscope operating in the microwave region of the electromagnetic spectrum (illustrated in Figure 4). Utilizing microwaves, with a wavelength of 3 centimeters, passing through a probe-forming aperture of 1.5 millimeters, the probe was scanned over a metal grating having periodic line features. Both the 0.5-millimeter lines and 0.5-millimeter gaps in the grating were easily resolvable, demonstrating sub-wavelength resolution having approximately one-sixtieth (0.017) the period of the imaging wavelength.
Extension of Synge's concepts to the shorter wavelengths in the visible spectrum presented significantly greater technological challenges (in aperture fabrication and positioning), which were not overcome until 1984 when a research group at IBM Corporation's Zurich laboratory reported optical measurements at a subdiffraction resolution level. An independent group working at Cornell University took a somewhat different approach to overcome the technological barriers of near-field imaging at visible wavelengths, and the two groups' results began the development that has led to the current NSOM instruments. The IBM researchers employed a metal-coated quartz crystal probe on which an aperture was fabricated at the tip, and designated the technique scanning near-field optical microscopy (SNOM). The Cornell group used electron-beam lithography to create apertures, smaller than 50 nanometers, in silicon and metal. The IBM team was able to claim the highest optical resolution (to date) of 25 nanometers, or one-twentieth of the 488-nanometer radiation wavelength, utilizing a test specimen consisting of a fine metal line grating.
Although the achievement of non-diffraction-limited imaging at visible light wavelengths had demonstrated the technical feasibility of the near-field aperture scanning approach, it was not until after 1992 that the NSOM began to evolve as a scientifically useful instrument. This advance in utility can be primarily attributed to the development of shear-force feedback systems and to the employment of a single-mode optical fiber as the NSOM probe, both of which were adapted for the near-field technique by Eric Betzig while working at AT&T Bell Laboratories.
NSOM Instrumentation
In an aperture-scanning NSOM instrument, the quantitative point spread function in the near-field can be assessed by a Gaussian profile whose 1/e intensity value is of the same order as the radius of the aperture at the tip of the NSOM probe. The mode of light propagation is primarily evanescent (and parallel to the specimen surface) when the radius of the illuminating source is less than one-third of the imaging light wavelength. In order to achieve an optical resolution greater than the diffraction limit (the resolution limit of conventional optical microscopy), the probe tip must be brought within this near-field region. For NSOM, the separation distance between probe and specimen surface is typically on the order of a few nanometers. Radiation near the source is highly collimated within the near-field region, but after propagation of a few wavelengths distance from the specimen, the radiation experiences significant diffraction, and enters the far-field regime.
| Interactive Tutorial | |||||||||||
|
|||||||||||
There are two fundamental differences between near-field and far-field (conventional) optical microscopy: the size of the specimen area that is illuminated, and the separation distance between the source of radiation and the specimen. In conventional far-field optical microscopy, the distance between the light source and the specimen is typically much greater than the wavelength of the incident light, whereas in NSOM, a necessary condition of the technique is that the illumination source is closer to the specimen than the wavelength of the illuminating radiation.
X-Y-Z Scanning
At the heart of all scanning probe microscopy techniques is the scanning system. Its design and function are primary determinants of the attainable scan resolution. The scanner must have low noise (small position fluctuations) and precision positioning capability (typically less than 1 nanometer). The required precision of the probe positioning usually necessitates that the entire instrument rest on a vibration isolation table, or be suspended by some other means, to eliminate the transfer of mechanical vibrations from the building to the instrument. Low-noise electronics and high-voltage amplifiers having large dynamic range are necessary to drive the piezo-electric actuators of the probe and specimen positioning systems. The piezos usually require power supplies providing 0 to +150 or -150 to +150 volts for full range displacement.
For most NSOM applications, it is necessary to maintain the probe in constant feedback above the specimen surface being imaged. Precise control of the probe is required because it must be maintained within the narrow near-field regime, but prevented from actually contacting the surface. The stringent requirement of maintaining a constant gap between the probe and the specimen is best met by employing a real-time feedback control system. The advantages of this type of position control are numerous. Perhaps the most important consideration is damage to the probe tip or the specimen, which is likely if the two come into contact. Furthermore, it is possible for the tip to accumulate debris from the specimen surface being scanned if contact is made. Although much less likely, this artifact can occur even with the tip under feedback control, especially if the feedback set point is not correctly chosen.
A further benefit of operating the probe scanning system with feedback control is to obtain accurate optical signal levels, eliminating the dramatic variations caused by the exponential dependence of these signals on the tip-to-specimen separation. The exponential variation of signal level with changing tip-to-specimen separation can produce artifacts in the image that do not accurately represent optical information related to the specimen. A critical requirement of the near-field techniques is that the probe tip must be positioned and held within a few nanometers of the surface in order to obtain high-resolution and artifact-free optical images, and this is not readily achieved without utilizing some form of feedback mechanism.
Several different techniques have been employed to monitor the z-position of the probe tip, and its instantaneous separation from the specimen surface. These methods include:
Interferometric measurement of the tip amplitude, using either a two-beam interferometer or a fiber interferometer.
Electron tunneling (limited to conductive specimens).
Detection of the light emitted through the tip (either in transmission or collection mode) and photon tunneling.
Constant force (atomic force feedback) is the most common method, and can be further subdivided as:
Diffraction of a separate light source by the tip.
Mechanical sensor attached to the tip (for example, a quartz tuning fork).
Capacitance detection.
To date, the two most commonly employed mechanisms of tip positioning have been optical methods that monitor the tip vibration amplitude (usually interferometric), and a non-optical tuning fork technique. Both of these are versions of the shear-force feedback method and are described in more detail in a following section.
Oscillatory Feedback Methods
In order to improve signal-to-noise ratios for the feedback signal, the NSOM tip is almost always oscillated at the resonance frequency of the probe. This allows lock-in detection techniques (basically a bandpass filter with the center frequency set at the reference oscillation frequency) to be utilized, which eliminates positional detection problems associated with low-frequency noise and drift. As the oscillating tip approaches the specimen, forces between the tip and specimen damp the amplitude of the tip oscillation.
A measure of the mechanical (or electrical) oscillator quality is given by a dimensionless parameter called the quality factor, or Q-factor, or simply Q. The quality factor is defined as the oscillator's resonance frequency divided by its resonance width. It is generally beneficial to maximize the Q of the probe oscillation in order to achieve greater stability and more sensitive tip height regulation. The lower the Q of the oscillating probe, the lower the signal-to-noise ratio, which results in correspondingly lower quality topographic information being obtained from the oscillatory feedback mechanism. Historically, the letter Q has been used to represent the ratio of reactance to resistance of an electrical circuit element. With regard to oscillator characteristics, the term "quality factor" was introduced after the symbol Q was arbitrarily chosen.
Typically, both the peak resonance and the Q-factor are found to change upon approach of the probe tip to the specimen surface. The tip oscillation amplitude and frequency can be monitored by several different techniques, which generally can be categorized within two groups. The shear-force mode utilizes lateral oscillation shear forces generated between the tip and specimen (parallel to the surface) to control the tip-specimen gap during imaging. In contrast, the tapping mode relies on atomic forces occurring during oscillation of the tip perpendicular to the specimen surface (as in AFM) to generate the feedback signal for tip control. Each oscillatory mode has several advantages and disadvantages.
Shear-Force Feedback
The shear-force feedback method laterally dithers the probe tip at a mechanical resonance frequency in proximity to the specimen surface. The dither amplitude is usually kept low (less than 10 nanometers) to prevent adversely affecting the optical resolution. For optimum image quality, shear-force feedback techniques are usually restricted to use with specimens that have relatively low surface relief, and longer scan times are required compared to operation in tapping mode. However, the straight probes typically employed in shear-force feedback techniques are easier to fabricate and have a lower cost per probe than their bent probe counterparts.
With respect to light throughput, the straight probe has a decided advantage over the bent probe, exhibiting much lower loss in propagation intensity. Shear-force imaging with a straight probe, however, is usually very difficult to perform in a liquid medium because the additional viscous damping of the fluid causes a dramatic decrease of the probe oscillation amplitude. In typical operation, as the oscillating probe approaches the specimen surface, the amplitude, phase, and frequency of oscillation each change, due to dissipative and adiabatic forces present at the tip of the probe. The probe oscillation damping due to tip-specimen interaction increases nonlinearly with decreasing tip-specimen separation.
The nature of the shear forces that are responsible for damping the probe tip oscillations during near-field specimen approach is the subject of much research interest. One group of investigators used electron tunneling current measurements between a metallized NSOM probe and specimen, in shear-force feedback mode, to conclude that the probe actually contacts the surface during the approach cycle of the oscillation. Measurements of the tunneling current, made as the tip approaches the specimen, indicate that the tip touches the specimen initially as the probe goes into feedback and continues to lightly touch the surface once per oscillatory cycle. From this information it is clear that the most beneficial approach is to make the feedback set-point as high as possible (for example, approximately 99.9 percent of the original undamped signal) in order to reduce the physical interactions between the probe and the specimen. In practice, the upper limit on the feedback set-point is determined by the signal-to-noise ratio of the feedback signal.
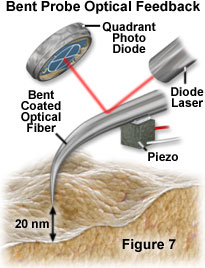
Optical feedback methods of monitoring the tip vibration amplitude were the most commonly employed during early development of shear-force techniques in NSOM, and can also be applied in the tapping mode. In this approach, for either the straight or bent probe types, a laser is tightly focused as close to the end of the NSOM probe as possible. With the straight probe variation, when under laser illumination, a shadow is cast by the probe onto a split photodiode. In the case of the bent probe method, the laser is reflected from the top surface of the probe to the split photodiode (similar to the optical feedback techniques employed in the AFM). With the laser feedback established, the probe is then vibrated in either tapping mode or shear-force mode, at a known frequency, utilizing a dither piezo (see Figure 7). The split photodiode collects the laser light, and the difference between the signals from each side of the detector is determined. A higher signal-to-noise ratio can be obtained by using a lock-in amplifier to select a portion of the signal that is at the same frequency as the dither piezo drive signal.
| Interactive Tutorial | |||||||||||
|
|||||||||||
The main problem associated with this type of feedback mechanism is that the light source (for example, a laser), which is used to detect the tip vibration frequency, phase, and amplitude, becomes a potential source of stray photons that can interfere with the detection of the NSOM signal. One mechanism for dealing with this effective increase in background signal is to provide a feedback light source that has a different wavelength (usually longer) than the near-field source. This scheme requires additional filtration in front of the detector to selectively block the unwanted photons originating within the feedback system. In most cases, the added filters also block a small percentage of the near-field photons, resulting in reduced signal levels. A non-optical feedback method is not subject to problems of this nature, and is a primary reason that methods such as the tuning-fork technique (described below) have become increasingly popular.
Piezoelectric quartz tuning forks were first introduced into scanning probe microscopy for use in scanning near-field acoustic microscopy. Later, tuning forks were incorporated into the NSOM to serve as inexpensive and simple, non-optical excitation and detection devices in distance control functions. Quartz crystals have the property of generating an electric field when placed under pressure and, conversely, of changing dimensions when an electric field is applied. This property is termed piezoelectric and occurs when the crystal is composed of molecules that lack both centers and planes of symmetry. Quartz crystals suitable for use in precision oscillators (digital clocks) and highly selective wave filters are mass-produced in huge quantities, making them relatively inexpensive. When quartz tuning forks are utilized for regulation in a feedback loop, their very high mechanical quality factor, Q (as high as approximately 10000), and corresponding high gain, provides the system with high sensitivity to small forces, typically on the order of a piconewton.
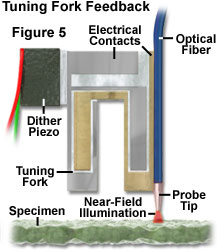
The basic configuration of the tuning-fork method used for shear-force tip feedback consists of a single mode optical fiber attached to one arm of a quartz crystal tuning fork, which is oscillated at the tuning fork's resonance frequency. The equivalent circuit for the tuning fork is a series RLC resonator in parallel with package capacitance. The most common tuning fork resonance frequency is 32,768 hertz (Hz), but the devices are available with resonances ranging from 10 kilohertz to several tens of megahertz.
The single mode optical fiber, routed to the NSOM head, is physically coupled to the crystal tuning fork, which in turn can be driven internally (electrically) or externally by a dither piezo to which the fork is rigidly attached. The mode of oscillation of the tuning fork depends upon the means of excitation. If the fork is (directly) driven electrically, the arms vibrate in opposite directions, whereas external mechanical excitation produces an oscillation in which both arms of the tuning fork move in the same direction. Figure 5 presents a schematic of a quartz tuning fork configured with an attached fiber for shear-force detection. The piezoelectric potential is acquired from electrodes on the fork and then amplified with a gain of approximately 100 (using an instrumentation amplifier) to produce a signal on the order of a few tens of millivolts. The signal is then fed into a lock-in amplifier and referenced to the drive signal of the oscillating tuning fork. The output from the lock-in amplifier (amplitude, phase, or a combination of amplitude and phase such as the x or y signals) is then compared to a user-specified reference signal in the control loop to maintain the probe in feedback above the specimen.
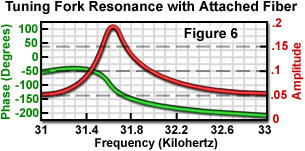
An example resonance curve produced by a 32.7-kHz tuning fork with the attached NSOM fiber is illustrated in Figure 6. The fork response was measured by sweeping the frequency from 31 kHz to 33 kHz and simultaneously measuring the amplitude and phase of the signal. Upon attachment of the fiber the resonance frequency shifts and the Q-factor of the resonance drops from approximately 20,000 to less than 1000. The Q is defined as:
where f(r) is the frequency at the maximum amplitude and Df is the width of the resonance peak at the points where the amplitude is equivalent to the peak amplitude divided by the square root of 2 (termed the root-mean-square), or approximately 70.7 percent of the peak amplitude.
There are several advantages of the tuning fork method that have led to its increased favor over optical techniques of tip regulation. Since the detection of the tip motion is not optical, there is no risk of additional stray light being introduced in the vicinity of the aperture that might interfere with the NSOM signal detection. Additionally, the tuning fork system does not require the tedious alignment procedures of a separate external laser source and associated focusing optical components. Because of the compactness and relative ease of use, the tuning fork method lends itself to applications requiring remote operation, such as those employed in vacuum systems or environmental control chambers.
Tapping-Mode Feedback
Tapping-mode feedback is another popular method for tip-to-specimen distance control, and is implemented using several different probe types. A useful design consists of a modified AFM cantilever and transparent tip, usually fabricated from silicon nitride and coated with metal on the bottom of the probe tip (discussed and illustrated in the accompanying section on near-field probes). The most commonly employed probe for tapping-mode methods is the conventional fiber optic probe having a near 90-degree bend close to the tip aperture. A representation of a bent optical fiber NSOM probe is presented in Figure 7.
The resolution of the tapping-mode near-field image is defined not only by the radius of the tip but also by the amplitude of the oscillation occurring perpendicular to the specimen surface. This is due to the acute sensitivity of the optical signal to the tip-to-specimen separation. In order to maintain high near-field resolution, it is necessary to either maintain a small oscillation amplitude relative to the tip aperture, or to compensate for larger oscillations. A mechanism that has been demonstrated to improve resolution is to synchronize the collected NSOM signal with the cycle of tip oscillation. Modulating the light coupled into the probe, and adjusting the phase such that the specimen is only illuminated when the tip is at its closest approach point, allows maintaining high resolution imaging at fairly large tip oscillation amplitudes.
There are several drawbacks in the application of bent optical probes, each of which can be attributed to the bend itself. A significant problem is the increased difficulty of the probe fabrication, especially when applying a metal coating to the tip. An additional disadvantage is the increased optical loss that occurs due to the bend in the probe. This loss in throughput efficiency is significant, and some published measurements indicate that bent optical fiber probes are at least an order of magnitude less efficient than conventional straight fiber probes. In certain operational modes of NSOM, the intensity loss is not a serious limitation because additional light can be coupled into the fiber to compensate, assuming sufficient laser power is available. The increase in optical coupling is an option because the optical losses, as well as increased heating, occur at the bend in the fiber and not at the aperture of the probe, where local heating would present a major problem. Another potential drawback with bent probes is a change in certain tip properties that occurs due to the presence of the bend, such as a decrease in extinction coefficients when performing polarized light measurements. Extinction ratios of approximately 70:1 have been measured in the far-field utilizing bent tips, as compared to values of greater than 100:1 with conventional straight fiber probes.
In the bent probe feedback mode, the probe is oscillated perpendicular to the specimen surface similar to tapping-mode AFM. The amplitude of oscillation can be monitored either mechanically, with a piezo-electric device such as a quartz tuning fork, or optically by reflecting a laser from the top surface of the tip cantilever. The probe is excited to oscillate in one of its eigenmodes and the tip-specimen distance is recorded and used dynamically as the feedback signal. The tip of the probe is prevented from adhering to the specimen due to the oscillation, which provides both a short contact time and a reverse driving force due to the cantilever bending. The success of this feedback method is dependent on the increased sensitivity of the tip-specimen distance control resulting from the resonance enhancement of the tip vibration. The sharpness and sensitivity of the tip vibration is characterized by the Q of the cantilever (similar to the measured Q in the shear-force oscillation). The Q value of the probe is substantially reduced by the viscosity of a liquid environment, and this is usually accompanied by a large shift in the resonance frequency.
An advantage of the tapping-mode over the shear-force mode is the relative ease with which nanoscale topographic images can be acquired, even when the specimen and probe are immersed in an aqueous or other fluid medium. A variety of research groups have used tapping-mode feedback in single molecule detection, in studies of biological systems, and for imaging in water, among other applications. When the oscillating tip approaches the specimen surface, a decrease in the oscillation amplitude of the tuning fork or in the optical feedback signal is observed. The origin of this damping is still not completely understood; however, several different mechanisms have been proposed, including capillary forces, van der Waals forces, and actual contact between the probe tip and specimen.
The action of damping forces on the probe tip can be conceptualized by envisioning a thin layer of water covering the specimen surface (which is actually the case if the specimen is in ambient conditions). When the tip is lowered into the thin layer of surface water, a drag force is imparted to the probe tip as it enters the water. The increased drag force decreases the oscillation amplitude of the end of the fiber probe, and shifts the fiber's resonance frequency. Both of these changes decrease the output signal from the tuning fork (for the non-optical method). When the reduced signal falls below the threshold of the reference signal, the tip is interpreted as being "engaged" and the feedback control system regulates the height of the tip above the specimen (based on the user specified reference signal).
| Interactive Tutorial | |||||||||||
|
|||||||||||
Near-field scanning optical microscopy is continuing to grow in use, especially for the microscopist interested in obtaining the highest possible optical resolution. However, NSOM is not limited to serving solely as an imaging/microscopy instrument; it can also be utilized for specimen manipulation, fabrication, and processing on a nanometric scale. A wide variety of NSOM applications outside of the imaging realm are evolving, including precision laser machining, nanometer-scale optical lithography, and localized release of caged compounds.
Some of the limitations of near-field optical microscopy include:
Practically zero working distance and an extremely small depth of field.
Extremely long scan times for high resolution images or large specimen areas.
Very low transmissivity of apertures smaller than the incident light wavelength.
Only features at the surface of specimens can be studied.
Fiber optic probes are somewhat problematic for imaging soft materials due to their high spring constants, especially in shear-force mode.
NSOM is currently still in its infancy, and more research is needed toward developing improved probe fabrication techniques and more sensitive feedback mechanisms. The future of the technique may actually rest in refinement of apertureless near-field methods (including interferometric), some of which have already achieved resolutions on the order of 1 nanometer. However, typical resolutions for most NSOM instruments range around 50 nanometers, which is only 5 or 6 times better than that achieved by scanning confocal microscopy. This moderate increase in resolution comes at a considerable cost in time required to set up the NSOM instrument for proper imaging, and in the complexity of operation. The greatest advantage of NSOM probably rests in its ability to provide optical and spectroscopic data at high spatial resolution, in combination with simultaneous topographic information. Combining atomic force measurements and near-field scanning optical microscopy has proven to be an extremely powerful approach in certain areas of research, providing new information about a variety of specimen types that is simply not attainable with far-field microscopy.
Contributing Authors
Jeremy R. Cummings, Thomas J. Fellers, and Michael W. Davidson - National High Magnetic Field Laboratory, 1800 East Paul Dirac Dr., The Florida State University, Tallahassee, Florida, 32310.
BACK TO NEAR-FIELD SCANNING OPTICAL MICROSCOPY