Polarized Light Microscopy
The de Sénarmont Compensator
The de Sénarmont compensator couples a highly precise quarter wavelength birefringent quartz or mica crystalline plate with a 180-degree rotating analyzer to provide retardation measurements having an accuracy that approaches one thousandth of a wavelength or less. The device is utilized for retardation measurements over an optical path difference range of approximately 550 nanometers (one wavelength in the green region) for the quantitative analysis of crystals, fibers, and birefringence in living organisms, as well as investigations of optical strain. In addition, de Sénarmont compensators are useful for emphasizing contrast in weakly birefringent specimens that ordinarily are difficult to examine under crossed polarized illumination.

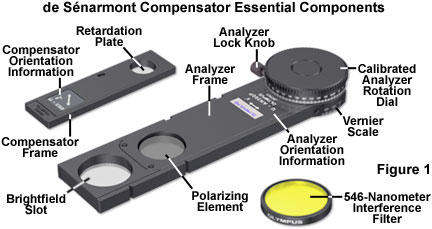
The basic optical components necessary to conduct de Sénarmont compensation retardation measurements are presented in Figure 1. Because quarter wavelength plates are designed for quantitative analysis at a specific wavelength, the microscope illumination must be rendered monochromatic through the utilization of interference filters. If a mercury arc-discharge lamp is used with de Sénarmont compensators, the e-line at 546.1 nanometers is ideal and can easily be isolated using the appropriate excitation filter. Tungsten-halogen lamps require an interference filter with a very narrow bandpass, as illustrated in Figure 1. In come cases, de Sénarmont compensators are designed to employ the 589-nanometer yellow line from mercury lamps. The compensator birefringent crystal is cut with the optical axis parallel to the plane of the plate surface and mounted in a fixed (non-rotating) orientation between the polarizer and analyzer. When the compensator is inserted into the optical train of a polarized light microscope, the slow (high refractive index) axis of the compensator wavefront ellipsoid is oriented either parallel or perpendicular to the analyzer, depending upon the manufacturer.
In practice, the de Sénarmont compensator is mounted in a rectangular frame (see Figure 1) and inserted through a standardized DIN slot (6 x 20 millimeters) into the optical train of a polarized light microscope at a 45-degree angle (Northwest-Southeast) to the polarizer and analyzer. Most microscopes are designed to position the de Sénarmont compensator between the specimen and the analyzer, above the rear objective aperture, in either an intermediate tube or a slot in the nosepiece. Because the de Sénarmont compensation method requires precise measurement of the analyzer transmission azimuth, this element is typically mounted in a 180 or 360-degree rotating frame (Figure 1) that is graduated in degrees with a vernier scale accurate to a tenth of a degree.

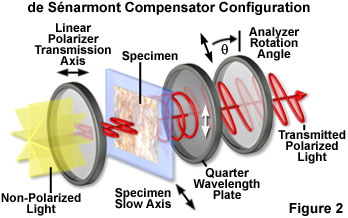
The principle behind the de Sénarmont compensation technique rests on the fact that the elliptically (or circularly) polarized light electric vector emerging from the specimen is superimposed upon the circular polarization vector introduced by the quarter wavelength plate to yield plane (linearly) polarized light having a vibration azimuth different from that of the polarizer (see Figure 2). The effect occurs because the quarter wavelength plate produces linearly polarized light from elliptically or circular polarized light that is incident on the crystal surface. The azimuth of the linear polarized light emerging from the compensator is a direct function of the optical path difference induced by the specimen. By rotating the analyzer until the specimen is extinct (dark), the azimuth of the vibration produced by the de Sénarmont compensator can be ascertained along with the optical path difference introduced by the specimen.
The action of a quarter wavelength retardation plate in the de Sénarmont configuration is illustrated in Figure 2. White light emitted by the microscope illuminator is first passed through an interference filter before encountering the linear polarizer positioned beneath the microscope condenser. Plane polarized light leaving the polarizer passes through the specimen, which has the slow axis of the index ellipse oriented at a 45-degree angle with respect to the polarizer, and is separated into orthogonal components (the ordinary and extraordinary wavefronts). Elliptical or circularly polarized light from the specimen (illustrated as circularly polarized light in Figure 2) is converted back into linearly polarized light by the quarter wavelength plate, but having an azimuth that is rotated 45 degrees relative to the initial wavefront exiting the polarizer. When the analyzer transmission axis is crossed (90-degrees) relative to that of the polarizer, the specimen appears green in the microscope eyepieces (see Figure 3(c)). Rotating the analyzer clockwise by 45 degrees (Figure 2) produces maximum transmission, while rotating the analyzer counterclockwise by 45 degrees yields maximum extinction.
In de Sénarmont compensation, rotation of the polarized light microscope analyzer through 180 degrees is equivalent to a relative specimen retardation value of one wavelength (when monochromatic light is employed). As the analyzer is rotated through its full 180-degree range, a birefringent specimen appears alternately dark or bright at 90-degree intervals. Because the retardation of most biological specimens, fibers, and many crystals is less than a full wavelength, de Sénarmont compensation is ideally suited for measuring the optical path difference in these specimens. In particular, the sensitivity of the technique enables measurements of intricate cellular details, such as organelles, cell walls, microtubules, and actin fibers, which induce retardation values ranging between one-twentieth and a full wavelength, with a typical accuracy of 0.15 nanometers.
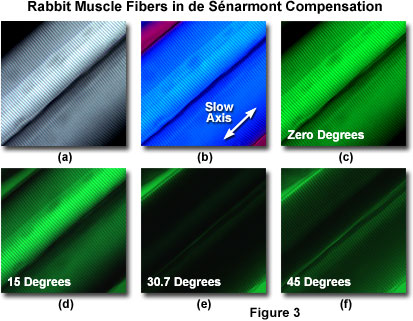
In order to obtain a measurement of specimen birefringence (and the related optical path difference), the de Sénarmont compensator is placed into the microscope optical train after the sign of birefringence and orientation of the specimen slow axis has been established with a first-order retardation plate. As an example, a pair of elongated, birefringent rabbit muscle fibers (myofibrils) is presented in Figure 3 to illustrate the de Sénarmont compensation technique. When the long axis of the fibers is oriented at a 45-degree angle with respect to the transmission axes of the analyzer and polarizer, the maximum level of birefringence is observed through the microscope eyepieces (Figure 3(a)) either with or without a de Sénarmont compensator in the optical train. Note the clearly defined striations aligned perpendicular to the long axis of the fiber, a feature that is characteristically observed in skeletal muscle.

Without prior knowledge of the birefringent characteristics (positive or negative sign) of a specimen, it may be difficult to ascertain the correct extinction angle for the analyzer during de Sénarmont compensation measurements. For example, in some cases the same rotation angle of the analyzer can produce extinction for a positively birefringent specimen that retards the wavefronts and a negatively birefringent specimen that advances the wavefronts. When a first-order (full wavelength) compensator or retardation plate is substituted for the de Sénarmont compensator in the optical train between the objective rear aperture and the analyzer, a known optical path difference of 530 (the exact wavelength depends on the manufacturer) will be added to the entire wavefront field. This technique can be used to determine the orientation of the index ellipse for birefringent specimens before undertaking relative retardation measurements using the de Sénarmont technique.
In the case of the muscle fibers illustrated in Figure 3, depending upon the orientation of the birefringent fibrils with respect to the retardation plate, the muscle will appear with either a higher or lower interference color (blue or yellow, respectively), depending upon orientation of the fibril slow axis with that of the retardation plate. In Figure 3(b), the myofibrils are oriented with their slow axis parallel to the slow axis of the first-order compensator and exhibit a bright blue interference color superimposed on a magenta background. The slow axes of both the fibers and the compensator are indicated by a double-headed white arrow in the figure. For accurate measurement of optical path difference by the de Sénarmont technique, the slow axis of the specimen should be aligned in a Northeast-Southwest (as in Figure 3) orientation with respect to the microscope polarizer and analyzer.
At the diagonal (Northeast-Southwest) orientation, the muscle fiber converts linearly polarized light passing through from the polarizer into elliptically polarized light, which is transformed back to linearly polarized light by the quarter wavelength retardation plate. A component of the linearly polarized light is transmitted through the analyzer to produce a bright image of the fiber on the dark background. The accuracy of the de Sénarmont compensator is dramatically increased by inserting a green interference filter into the optical path, as previously discussed. In this case (using wideband tungsten-halogen illumination), the fibrils appear green on a black background, as illustrated in Figure 3(c). Compensation is determined by rotating the analyzer from its crossed position through a measured angle until the intensity of the fiber is minimized (extinction; illustrated in Figure 3(e)). Images taken before (Figure 3(d)) and after (Figure 3(f)) extinction is achieved (Figure 3(e)) illustrate how the fibrils appear at analyzer rotation angles of 15 and 45 degrees, respectively. Note that as the analyzer is rotated to obtain extinction of the fibrils, the background is brightened from black to green. The rotation angle of the analyzer at extinction is equal to one-half of the full phase shift between the orthogonal (ordinary and extraordinary) wavefronts passing through the specimen. Therefore, the relative retardation (in nanometers) is described by the following equation (for monochromatic light at 546 nanometers):
where q is the rotation angle of the analyzer and G is the relative retardation or optical path difference. In the case of the rabbit muscle fibers illustrated in Figure 3, the green interference filter has a narrow bandpass centered at 546 nanometers (3.03 nanometers per degree), and the analyzer rotation angle was 30.7 degrees (Figure 3(e)). Therefore, the measured retardation value for these fibers is approximately 93.1 nanometers. For highly accurate measurements of relative retardation, several trials should be conducted. In addition, the specimen can be rotated by 90-degrees and the analyzer rotated to the opposite side of the crossed position to obtain extinction for additional measurements (and better accuracy).
The de Sénarmont compensation technique is extremely sensitive, but the quantitative retardation measurement range is restricted of a single wavelength (approximately 550 nanometers). In order to achieve the highest possible accuracy, the quarter wavelength plate must introduce exactly one quarter of a wavelength retardation for the wavelength used in the measurement. Otherwise, or in the case of measurements in white light, the optical path difference produced by the compensator must be accurately known. Sensitivity of the de Sénarmont technique can be improved by the application of a half-shadow device (such as a Nakamura plate), in some cases to measure optical path differences as small as one two-thousandth of a wavelength. However, when attempting to measure retardation values to this precision, other sources of error should be carefully considered, such as the deviation of the quarter wavelength crystal thickness from that of the interference filter utilized to generate monochromatic light.
Contributing Authors
William K. Fester - Scientific Equipment Group, Olympus America Inc., Two Corporate Center Drive, Melville, New York, 11747.
Michael W. Davidson - National High Magnetic Field Laboratory, 1800 East Paul Dirac Dr., The Florida State University, Tallahassee, Florida, 32310.
BACK TO COMPENSATORS AND RETARDATION PLATES
BACK TO POLARIZED LIGHT MICROSCOPY
