
Spectral Characteristics of Common Biological Stains
A wide variety of synthetic and naturally occurring biological dyes are available to the microscopist for selective staining of intracellular organelles in cells and tissues. Biological stains dramatically improve specimen contrast in brightfield illumination, and have been utilized for many years in histological preparations targeted at studies in anatomy, pathology, physiology, and similar disciplines. Compare the information contained in this section on the visible light absorption spectral data for common biological stains to determine suitability for use in black & white and color photomicrography and digital imaging.
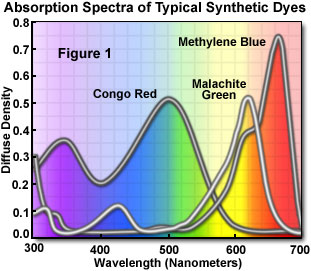
The absorption and transmission characteristics of common biological stains are published in the Sigma-Aldrich Handbook of Stains, Dyes, and Indicators and H. J. Conn's Biological Stains, which include actual spectroscopic data for hundreds of dyes. Typical visible light absorption spectra for red (Congo Red), green (Malachite Green), and blue (Methylene Blue) dyes are presented in Figure 1. In this figure, absorption (diffuse density) is plotted as a function of wavelength from 300 to 700 nanometers.
Congo Red has a strong absorption band at 340 nanometers in the near-ultraviolet region and another at 500 nanometers near the blue-green transition region. This dye transmits red wavelengths above 560 nanometers and thus, appears red to the eye. Appearing visually as a green dye, Malachite Green has a strong absorption band centered at 600 nanometers near the yellow-red transition region, with a wide transmission band (passing blue and green light) between 400 and 550 nanometers. Methylene blue has a strong absorption band centered at 660 nanometers, in the red region of the visible spectrum, and transmits wavelengths below 600 nanometers, bestowing a blue color to the dye.
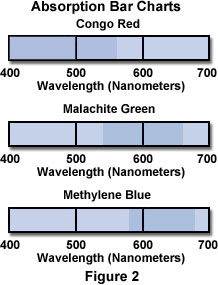
When the diffuse density (absorption) by a stain exceeds 0.1, the wavelength band falling within the region greater than 0.1 is considered absorbed. This can conveniently be represented as a bar graph, such as the ones illustrated in Figure 2. The darker areas represent regions of absorption by the dyes that exceed a diffuse density of 0.1, and the lighter areas represent wavelengths passed (not absorbed) by the dye. This type of graph provides a simple index for comparing a set of dyes to quickly determine the suitable dye for any particular staining application.
|
||||||||||||||||||||||||||||||||||||||||||||||||||||||||||||||||||||||||||||||||||||||||||||||||||||||||||||||||||||||||||||||||||||||||||||||||||||||||||||||||||||||||||||||||||||||||||||||||||||||||||||||||||||
Table 1
A compilation of bar charts for the common biological stains are listed in Table 1. Use this table as a reference in choosing dyes to stain biological specimens for photomicrography using black & white film.
Contributing Authors
Mortimer Abramowitz - Olympus America, Inc., Two Corporate Center Drive., Melville, New York, 11747.
Michael W. Davidson - National High Magnetic Field Laboratory, 1800 East Paul Dirac Dr., The Florida State University, Tallahassee, Florida, 32310.