
Kodak Wratten Filters for Black & White Photomicrography
The absorption and transmission characteristics of Kodak Wratten filters are published in the Kodak Photographic Filters Handbook (Publication No. B-3), which includes tabulations of spectral data at various wavelengths. A typical visible light absorption spectrum for one of these filters, the Wratten number 34a, is illustrated in Figure 1. In this figure, absorption (diffuse density) is plotted as a function of wavelength from 300 to 700 nanometers.
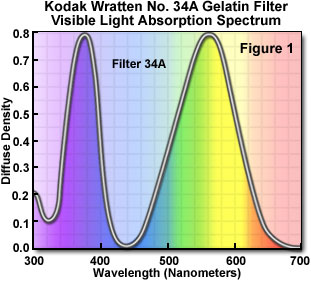
The 34a filter has a strong absorption band at 370 nanometers, in the ultraviolet region of the spectrum, and another centered at 560 nanometers in the green-yellow transition region of the visible spectrum. This filter passes or transmits wavelengths whose diffuse density is less than 0.1, so the wavelength ranges transmitted by the 34a filter are 410 to 470 nanometers (blue light) and 660 to 700 nanometers (red light).
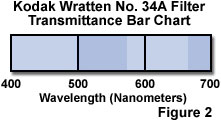
The transmission bands of filters are conveniently represented as a bar graph, such as the one illustrated in Figure 2. The darker areas represent regions of transmission by a filter that exceed 10 percent, and the lighter areas represent wavelengths blocked by the filter. This type of graph provides a simple index for comparing a set of filters to quickly determine the suitable filter for any particular application.
|
||||||||||||||||||||||||||||||||||||||||||||||||||||||||||||||||||||||||||||||||||||||||||||||||||||||||||||||||||||||||||||||||||||||||||||||||||||||||||||||||||||||||||||||||||||
Table 1
A compilation of bar charts for the common Kodak Wratten color filters are listed in Table 1. Use this table as a reference in choosing filters to enhance contrast in stained specimens using black & white photomicrography.
Contributing Authors
Mortimer Abramowitz - Olympus America, Inc., Two Corporate Center Drive., Melville, New York, 11747.
Michael W. Davidson - National High Magnetic Field Laboratory, 1800 East Paul Dirac Dr., The Florida State University, Tallahassee, Florida, 32310.