
Modulation Transfer Function
Interactive Java Tutorials
Cutoff Frequency and Airy Disk Size
The modulation transfer function of an optical system is closely related to the distribution of light from the image of a point object produced by the system, a term commonly referred to as the point spread function (PSF). This interactive tutorial explores the changes in the point spread function distribution as spatial frequency cutoff is varied in a typical modulation transfer function plot.
The tutorial initializes with the display of a typical modulation transfer function plot drawn at the highest cutoff spatial frequency for a hypothetical virtual optical system, which is 5000 lines per millimeter. Presented to the right of the MTF plot are the corresponding Airy disk pattern and point spread function for a point source of light that has been imaged by an optical system having this modulation response curve.
To operate the tutorial, utilize the Cutoff Frequency slider to adjust the shape and limiting spatial frequency of the modulation transfer function. As the slider is moved to the right, cutoff frequency values decrease, producing a corresponding increase in Airy disk size and the intensity distribution of the point spread function. At the limiting boundary of the slider, the cutoff frequency has dropped to 500 lines per millimeter, resulting in the largest Airy disk and point spread function sizes.
In optical microscopy, the image of a specimen is a superposition of the total point spread function, and constitutes the diffraction pattern of Airy disks produced by the specimen at the intermediate image plane. According to Abbe's theory of image formation, the objective rear aperture determines the highest spatial frequency passed by a microscope, which represents the cutoff frequency of the modulation transfer function. Because diffraction effects establish the ultimate limits to resolution in the microscope, a perfectly aberration-free instrument is termed diffraction limited. A typical modulation transfer function for a diffraction-limited microscope is illustrated in Figure 1(a). Image contrast (Modulation) is highest at low spatial frequencies, decreasing to a value of zero as the spatial frequency increases.
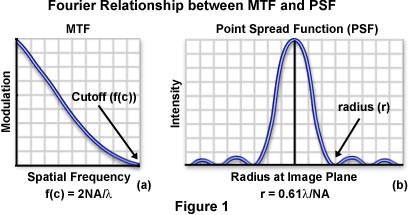
Eventually, the microscope reaches a limiting spatial frequency (the cutoff frequency), which is related to the objective numerical aperture (NA) and illumination wavelength (l) by the following equation:
This relationship expresses, in terms of spatial frequency, the fact that resolution in the microscope increases with larger numerical apertures and shorter illumination wavelengths. Another indicator of optical resolution, the Raleigh two-point criterion, is based on the distribution width of the point spread function. Two points that are adjacent in a specimen are distributed by the optical system into two individual point spread functions. The width of these point spread function distributions determines how close the points can be to each other and still be resolved by the microscope.
When combined with the phase transfer function, the modulation transfer function of an optical system becomes the optical transfer function, which is the Fourier transfer of the point spread function. A fundamental property of Fourier transforms is that the distribution width of a function is inversely proportional to the distribution width of its Fourier transform. Considering the relationship between cutoff frequency and numerical aperture discussed above, the radius (r) of the first-order diffraction ring of the point spread function (or Airy disk) is expressed by the equation:
It is obvious that r and f(c) are inversely proportional to each other, as required by Fourier theory. It is important to note that the optical microscope does not suddenly stop resolving spacings that are less than the Abbe limit. Instead, there is a gradual drop in image contrast with increased spatial frequency that often renders specimens with low inherent contrast unresolvable even when they are spaced at distances greater than the resolution limit of the microscope.
Contributing Authors
Kenneth R. Spring - Scientific Consultant, Lusby, Maryland, 20657.
Matthew J. Parry-Hill and Michael W. Davidson - National High Magnetic Field Laboratory, 1800 East Paul Dirac Dr., The Florida State University, Tallahassee, Florida, 32310.
BACK TO MODULATION TRANSFER FUNCTION