Interactive Java Tutorials
Geometrical Transformation:
Pan, Scroll, Rotate, Flip, Scale, and Zoom
The microscopist must often arrange digital images on the output display device for purposes of visually comparing image details, or for illustrating differences between two or more images. Such display operations are facilitated through software packages that enable interactive panning, scrolling, flipping, scaling, and zooming of digital images. Zooming to enlarge image details is useful for the visualization of small structures present in a digital image, and scaling is often necessary to format a digital image to fit within the boundaries of a display medium, as in the case of displaying a collection of thumbnail images.
This interactive tutorial explores the effects of panning, scrolling, rotating, flipping, scaling, and zooming operations on a variety of digital images. The tutorial initializes with a randomly selected specimen image (captured in the microscope) appearing in the window entitled Specimen Image. Each specimen name includes, in parentheses, an abbreviation designating the contrast mechanism employed in obtaining the image. The following nomenclature is used: (FL), fluorescence; (BF), brightfield; (DF), darkfield; (PC), phase contrast; (DIC), differential interference contrast (Nomarski); (HMC), Hoffman modulation contrast; and (POL), polarized light. Visitors will note that specimens captured using the various techniques available in optical microscopy behave differently during image processing in the tutorial.
To operate the tutorial, select a specimen image from the Choose A Specimen pull-down menu. The specimen image may be repositioned in the window by clicking anywhere inside of the specimen image and dragging it with the mouse. The Zoom/Scale Factor slider controls the size at which the specimen image is displayed in the Specimen Image window. When the mouse cursor is moved into the Specimen Image window, a small crosshair will appear in the center of the window. The crosshair indicates the point in the image that will remain stationary while the zoom operation is performed. The specimen image may be rotated at 90-degree intervals with the Rotate radio button panel, or flipped either horizontally or vertically with the Flip check box panel. Visitors should explore the effects of repositioning, flipping, rotating, scaling, and zooming in on the specimen image.
In the nomenclature of digital image processing, panning refers to the horizontal repositioning of a digital image on the output display device, while scrolling refers to the vertical repositioning of the image. The digital image may be rapidly repositioned by copying the pixel values to new (x,y) locations to produce the effect of panning or scrolling. Movement is sufficiently rapid and smooth, if controlled by a mouse, trackball, or joystick, to give the sensation of fluid, continuous motion. To aid in these manipulations, location of the region of interest is usually designated by a cursor in the overlay plane. In the tutorial, panning and scrolling of the specimen image is possible throughout the zoom range available with the Zoom/Scale Factor slider.
Image rotation is performed at 90-degree intervals in the tutorial, with the designated center of the image serving as the rotational origin. Horizontal flipping "turns" the image over from left to right around the horizontal midpoint of the image, and vertical flipping "turns" the image over from top to bottom around the vertical midpoint. These operations are useful in changing the display orientation of a digital image.
Zoom of an image is accomplished by making multiple copies of the pixels of the selected region. A zoom operation on a digital image produces an increase in its displayed size, with a corresponding increase in "pixel" size. Although zooming does not increase the information content of the region of interest, it can be helpful in the visualization of small structures or for the examination of individual pixel brightness values. There are several useful algorithms available for performing a zoom operation on a digital image. The simplest and most accurate algorithm, known as the discrete replicating zoom, performs by displaying multiple copies of each pixel in the area of interest. Because this algorithm operates in discrete steps, it can produce zoomed images at integral zoom factors of 2x, 4x, and higher. Individual pixels become readily apparent at 4x or higher zoom factors, depending upon the spatial resolution of the image.
Fractionally zoomed images can also be obtained by varying the number of copies made of each pixel in the area of interest. The most commonly employed algorithm for this operation is known as the fractional replicating zoom, which works by copying pixels from the source image into the zoomed image based upon an inexact spatial correspondence between the two. In effect, pixel addresses in the source image are calculated fractionally, based on the ratio between the zoomed image dimensions to the source image dimensions. Because the calculated pixel address is fractional, a decision must be made as to what to do with the fractional part of the address. There are several approaches to this problem. One of the most common, interpolation, is based on an estimation of the value between two or more known values, and there are a wide variety of published algorithms to address this type of calculation.
One of the simplest interpolation algorithms is nearest neighbor interpolation, where the fractional part of the pixel address is discarded, and the pixel brightness value at the resulting integral address in the source image is copied to the zoomed image. Because of the inexactness of the spatial correspondence between the two images, more copies will be made of certain pixels in the source image than of others. This can result in spatial distortion of features in the zoomed image, and nearest neighbor interpolation is therefore unreliable for measurement purposes. For integral zoom factors that are even (2x, 4x, etc.), nearest neighbor interpolation produces the same results as the discrete replicating zoom algorithm.
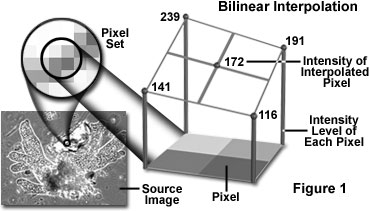
An interpolation technique that reduces the visual distortion caused by the fractional zoom calculation is the bilinear interpolation algorithm, where the fractional part of the pixel address is used to compute a weighted average of pixel brightness values over a small neighborhood of pixels in the source image. Bilinear interpolation (see Figure 1) produces pseudo-resolution that gives a more aesthetically pleasing result, although this result is again not appropriate for measurement purposes.

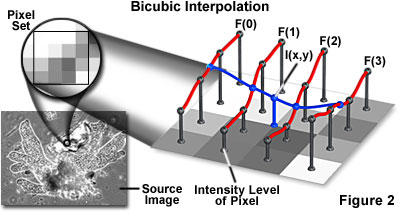
The technique of bicubic interpolation (illustrated in Figure 2) produces less blurring of edges and other distortion artifacts than bilinear interpolation, but is more computationally demanding. Bicubic interpolation involves fitting a series of cubic polynomials to the brightness values contained in a 4 x 4 array of pixels surrounding the calculated address. First, four cubic polynomials, F(i) (where i = 0, 1, 2, 3), are fitted to the control points in the y-direction (the choice of starting direction is actually arbitrary). Next, the fractional part of the calculated pixel's address in the y-direction is used to fit another cubic polynomial in the x-direction, based on the interpolated brightness values that lie on the curves. Substituting the fractional part of the calculated pixel's address in the x-direction into the resulting cubic polynomial then yields the interpolated pixel's brightness value.

The choice of polynomial utilized in the bicubic interpolation algorithm can have a significant impact on the accuracy and visual quality of the interpolated image. Splines are piecewise polynomial functions that are often used in bicubic interpolation algorithms. A significant requirement of the splines used for bicubic interpolation is that they should always interpolate the brightness values of the pixels contained in the 4 x 4 control grid. Because many of the spline functions have control parameters that are subject to the choice of the programmer, reproducibility becomes an issue when comparing the results of bicubic interpolation algorithms between images.
Fractal interpolation, which is based upon self-similar or fractal functions, is popular with some programmers because the technique prevents excessive smoothing of image details, and appears to provide additional detail at large zoom factors. The additional detail is not real, however, so fractal interpolation is not appropriate for measurement purposes. When accurate measurements are the goal, more precise algorithms such as the kriging technique should be employed. Kriging encompasses a family of interpolation algorithms that is based upon a generalized least-squares algorithm that uses variograms as weighting functions. A number of variants of kriging are in general use, including simple kriging, ordinary kriging, universal kriging, block kriging, co-kriging, and disjunctive kriging. Kriging has an advantage over other interpolation procedures because the estimated values have a minimum and quantifiable error associated with them.
Zoom algorithms may also be used to perform image scaling, which refers to a reduction in size of the displayed digital image, and often results in a loss of image resolution. Scaling is a useful operation for formatting a digital image to fit within the bounds of a display medium, as in the case of displaying a collection of thumbnail images. The effects of scaling an image vary to a significant degree, depending on a wide spectrum of image parameters. Interpolation or averaging methods cause fine details to disappear, and sampling (showing every nth pixel) often produces aliasing artifacts. In the tutorial, scaling is performed when the Zoom/Scale Factor slider is moved to the left of the 1x position.
Contributing Authors
Kenneth R. Spring - Scientific Consultant, Lusby, Maryland, 20657.
John C. Russ - Materials Science and Engineering Department, North Carolina State University, Raleigh, North Carolina, 27695.
Matthew J. Parry-Hill, Thomas J. Fellers, and Michael W. Davidson - National High Magnetic Field Laboratory, 1800 East Paul Dirac Dr., The Florida State University, Tallahassee, Florida, 32310.
BACK TO DIGITAL IMAGE PROCESSING TUTORIALS
