
Basic Concepts in Digital Image Processing
The widespread availability of relatively low-cost personal computers has heralded a revolution in digital image processing activities among scientists and the consumer population in general. Coupled to digitization of analog images (mainly photographs) by inexpensive scanners, and image acquisition with electronic sensors (primarily though charge-coupled devices or CCDs), user-friendly image-editing software packages have led to a dramatic increase in the ability to enhance features, extract information, and to easily modify the properties of a digital image.
Digital image processing enables the enhancement of visibility for detail in images using algorithms that apply arithmetic and statistical procedures to stored pixel values, instead of the classical darkroom manipulations for filtration of time-dependent voltages necessary for analog images and video signals. Even though many image processing algorithms are extremely powerful, the average user often applies operations to digital images without concern for the underlying principles behind these manipulations. The images that result from careless manipulation are often severely degraded or otherwise compromised with respect to those that could be produced if the power and versatility of the digital processing software were correctly utilized.
Optical microscopy is a rapidly developing field that has come to be highly dependent upon digital image processing techniques, both for aesthetic balance and cosmetic touches, as well as rehabilitation and analytical purposes. However, even when the microscope is configured correctly and performing optimally, captured digital images often display uneven backgrounds, excessive noise, aberration artifacts, poor contrast, out-of-focus regions, intensity fluctuations, and can also suffer from color shifts and color balance errors. In addition, images that appear perfectly sharp and crisp with excellent color saturation in the microscope can often be mangled by the image sensor to produce artifacts such as aliasing, camera noise, improper gamma correction, white balance shifts, poor contrast, and brightness fluctuations.
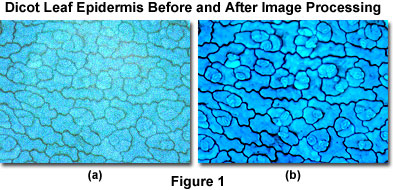
Presented in Figure 1 is a digital image of a thin section of stained dicot leaf epidermis captured in brightfield illumination with a standard optical microscope. As originally imaged (Figure 1(a)), the thin section displays a considerable amount of noise and suffers from uneven illumination throughout the viewfield, leading to poor contrast and lack of definition in specimen detail. Following background subtraction, gamma correction, histogram stretching, and adjustment of hue, color balance, and saturation, the processed image (Figure 1(b)) is considerably improved.
Pre-Processing Evaluation of Digital Images
After digital images have been captured, and prior to initiating processing algorithm applications, each image should be evaluated with regard to its general characteristics, including noise, blur, background intensity variations, brightness and contrast, and the general pixel value distribution (histogram profile). Attention should be given to shadowed regions to determine how much detail is present, as well as bright features (or highlights) and areas of intermediate pixel intensity. This task is most easily accomplished by importing the image into one of the popular software editing programs, such as Adobe Photoshop, Corel Photo-Paint, Macromedia Fireworks, or Paint Shop Pro.
Each image-editing program has a statistics or status window that enables the user to translate the mouse cursor over the image and obtain information about specific pixel values at any location in the image. For example, the Photoshop Info Palette provides continuously updated pixel information, including x and y coordinates, RGB (red, green, and blue) color values, CMYK (cyan, magenta, yellow, black) conversion percentages, and the height and width of a marquee selection within the image. Preference options in the palette display include selecting alternative color-space models for information readout. Among the models available in Photoshop are grayscale, HSB (hue, saturation, and brightness), web color (the 216 colors that overlap in the Windows and Macintosh 8-bit or 256 color display palettes), actual color, opacity, and Lab color (device-independent color space).
By evaluating the intensities (grayscale and color) and histogram positions of various image features, the black and white set points for stretching and sliding of the entire histogram for contrast adjustments can be determined. The image should also be checked for clipping, which is manifested by the appearance of saturated white or underexposed black regions in the image. In general, clipping should be avoided, both during image acquisition, and while the image is being processed. Images that have been adversely affected by background intensity variations should be corrected by flat-field techniques or background subtraction prior to applying histogram manipulations.
Look-Up Tables
Several of the fundamental digital image processing algorithms commonly employed in optical microscopy function through a technique known as single-image pixel point operations, which perform manipulations on sequential individual pixels rather than large arrays. The general equation utilized to describe single-image pixel point processes for an entire image array is given by the relationship:
where I(x,y) represents the input image pixel at coordinate location (x,y), O(x,y) is the output image pixel having the same coordinates, and M is a linear mapping function. In general, the mapping function is an equation that converts the brightness value of the input pixel to another value in the output pixel. Because some of the mapping functions utilized in image processing can be quite complex, performing these operations on a large image, pixel-by-pixel, can be extremely time-consuming and wasteful of computer resources. An alternative technique used to map large images is known as a look-up table (LUT), which stores an intensity transformation function (mapping function) designed so that its output gray-level values are a selected transformation of the corresponding input values.
When quantized to 8 bits (256 gray levels) each pixel has a brightness value that ranges between 0 (black) and 255 (white), to yield a total of 256 possible output values. A look-up table utilizes a 256-element array of computer memory, which is preloaded with a set of integer values defining the look-up table mapping function. Thus, when a single-pixel process must be applied to an image using a look-up table, the integer gray value for each input pixel is utilized as an address specifying a single element in the 256-element array. The memory content of that element (also an integer between 0 and 255) overrides the brightness value (gray level) of the input pixel and becomes the output gray value for the pixel. For example, if a look-up table is configured to return a value of 0 for input values between 0 and 127 and to return a value of 1 for input values between 128 and 255, then the overall point process will result in binary output images that have only two sets of pixels (0 and 1). Alternatively, to invert contrast in an image, a look-up table can return inverse values of 0 for 255, 1 for 254, 2 for 253, and so forth. Look-up tables have a significant amount of versatility and can be utilized to produce a wide variety of manipulations on digital images.
Image transformations that involve look-up tables can be implemented by either one of two mechanisms: at the input so that the original image data are transformed, or at the output so that the transformed image is displayed but the original image remains unmodified. A permanent transformation of the original input image may be necessary to correct for known defects in detector properties (for example, nonlinear gain characteristics) or to transform the data to a new coordinate system (from linear to logarithmic or exponential). When only the output image should be modified, the image transformation is performed just before the digital image is converted back to analog form by the digital-to-analog converter for display on a computer monitor. In some cases, the results of the transformation specified by the output look-up table(s) are displayed visually on the monitor, but the original image data are not altered.
Look-up tables are not restricted to linear or monotonic functions, and a variety of nonlinear look-up tables are utilized in signal processing to correct for camera response characteristics or to emphasize a narrow region of gray levels. A good example of the utility of a nonlinear look-up table is the correction of recorded images that have been inadvertently captured with an incorrect camera gamma adjustment. In addition, monochrome or color images can also be converted to generate negatives for photography. Other applications include pseudocoloring and sigmoidal look-up tables that emphasize a selected range of gray values targeted to enhance desired features or to adjust the amount of image contrast.
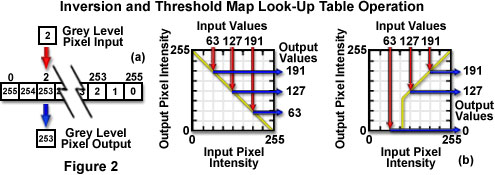
Presented in Figure 2 are look-up table mapping functions for image contrast inversion using both a 256-element memory pre-loaded register and a table map (Figure 2(a)), and a thresholding operation using only a table map (Figure 2(b)). The input pixel gray level is utilized to specify the address of the look-up table element whose content provides the gray level of the output pixel in the memory register (Figure 2(a)). The square look-up table map presents an alternative method of calculating output pixel values based on those of the input pixel. To use the map, first determine the input pixel gray-level value, and then extend a vertical line from the input value to the mapping function. A horizontal line is then drawn from the intersection of the vertical line and the mapping function to produce the output pixel gray level on the vertical axis of the map (Figure 2(b) and 2(c)). In the case of the thresholding operation (Figure 2(c)), all pixels having an input value below 100 are mapped to black (0), while other input pixel intensities are unaltered.
Flat-Field Correction and Background Subtraction
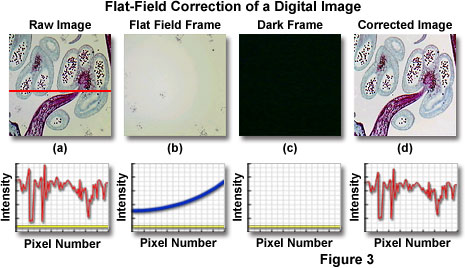
A digital image acquired from a microscope, camera, or other optical device is often described as a raw image prior to processing and adjustment of critical pixel values (see Figure 3). In many cases, the raw image is suitable for use in target applications (printing, web display, reports, etc.), but such an image usually exhibits a significant level of noise and other artifacts arising from the optical and capture system, such as distortions from lens aberrations, detector irregularities (pixel non-uniformity and fixed-pattern noise), dust, scratches, and uneven illumination. In addition, improper bias signal adjustment can increase pixel values beyond their true photometric values, a condition that leads to significant errors in measuring the amplitudes of specific image features. Errors in the raw image are manifested as dark shadows, excessively bright highlights, specks, mottles, and intensity gradients that alter the true pixel values. In general, these errors are particularly evident in digital images having bright, uniform backgrounds, which are produced by a variety of common microscope illumination modes, including brightfield, oblique, phase contrast, and differential interference contrast (DIC). Fluorescence images having medium gray or bright backgrounds, though relatively rare, may suffer from similar errors.
Applying flat-field correction techniques to raw digital images can often ensure photometric accuracy and remove common image defects to restore the fidelity of features and achieve a visual balance. These correction steps should be undertaken before measuring light amplitudes or obtaining other quantitative information from pixel intensity values, although the corrections are not necessary in order to display or print an image. Flat-field and background subtraction techniques usually require collection of additional image frames under conditions similar to those employed to capture the primary raw specimen image.
Most of the flat-field correction schemes utilize two supplemental image frames, in addition to the raw image, to calculate final image parameters (Figure 3). A flat-field reference frame can be obtained by removing the specimen and capturing the featureless viewfield at the same focus level as the raw image frame. Flat-field reference frames should display the same brightness level as the raw image and take advantage of the full dynamic range of the camera system to minimize noise in the corrected image. If both the raw image and flat-field reference frame have low signal amplitudes and contain a significant amount of noise, the corrected image will also be dark and noisy. In order to compensate for noise and low intensity, flat-field reference frames can be exposed for longer periods than those used for capturing raw images. Several averaged frames (3-20) can be added together to create a master flat-field reference frame with a very low noise level.
In addition to a flat-field reference frame, a dark reference frame is collected, which effectively records the output level of each pixel when the image sensor is exposed to a dark scene, absent microscope illumination. The dark frame contains the pixel bias offset level and noise acquired from electronic and thermal sources that contaminate the raw image. Offset pixel values derive from the positive voltage applied to the image sensor in order to digitize analog intensity information from each photodiode. Electronic noise originates from camera readout and related sources, and thermal noise is generated by kinetic vibration of silicon atoms in the collection wells and substrate of semiconductor-based sensors. Collectively, these noise sources are referred to as dark noise, and are a common artifact in digital image sensors, which can contribute up to 20 percent of apparent pixel amplitudes. In order to ensure photometric accuracy, these sources must be subtracted from the flat-field reference frame and raw image. Dark frames are generated by integrating the image sensor output for the same period as the raw image, but without opening the camera shutter. Master dark frames can be prepared by averaging several individual dark frames together to increase signal intensity.
| Interactive Tutorial | |||||||||||
|
|||||||||||
Once the necessary frames have been collected, flat-field correction is a relatively simple operation that involves several sequential functions. First, the master dark frame is subtracted from both the raw image and flat-field reference frames, followed by the division of the resulting values (Figure 3). In effect, the raw frame is divided by the flat-field frame after the dark frame has been subtracted from each frame and the quotient is multiplied by the mean pixel value in order to maintain consistency between the raw and corrected image intensities. Individual pixels in the corrected image are constrained to have a gray level value between 0 and 255, as a precaution against sign inversion in cases where the dark reference frame pixel value exceeds that of the raw image. The flat-field correction illustrated in Figure 3 shows a plot of intensity profile across a selected region of the image versus pixel number for the raw, flat-field, and dark frames, as well as that for the corrected image.
Background subtraction is a technique that results in localized alterations of each pixel value in the raw image, depending upon the intensity of a corresponding pixel at the same coordinate location in the background image. As a result, nonuniformities in detector sensitivity or illumination (including mottle, dirt, scratches, and intensity gradients) can be compensated by storing a background image of an empty microscope field as a reference image. Video-enhanced contrast (VEC) microscopy is critically dependent on background subtraction for removal of both stray light and artifacts from highly magnified images of specimens having poor contrast. In this case, the background image is obtained by defocusing or displacing the specimen from the field of view. The resulting background image is stored and continuously subtracted from the raw image, producing a dramatic improvement in contrast. This technique is also useful for temporal comparisons to display changes or motion between viewfields.
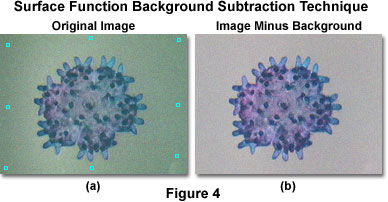
When it is not feasible to capture a background image in the microscope, a surrogate image can be created artificially by fitting a surface function to the background of the captured specimen image (see Figure 4). This artificial background image can then be subtracted from the specimen image. By selecting a number of points in the image that are located in the background, a list of brightness values at various positions is obtained. The resulting information can then be utilized to obtain a least squares fit of a surface function that approximates the background. In Figure 4, eight adjustable control points are used to obtain a least squares fit of the background image with a surface function B(x, y) of the form:
where c(0) ... c(5) are the least squares solutions, and (x, y) represents the coordinates of a pixel in the fitted background image. The specimen presented in Figure 4 is a young starfish captured digitally with an optical microscope configured to operate in oblique illumination. The control points should be chosen so that they are evenly distributed across the image, and the brightness level at each control point should be representative of the background intensity. Placing many points within a small region of the image while very few or none are distributed into surrounding regions will result in a poorly constructed background image. In general, background subtraction is utilized as an initial step in improving image quality, although (in practice) additional image enhancement techniques must often be applied to the subtraction image in order to obtain a useful result.
Images modified by flat-field correction appear similar to those obtained with background subtraction, but performing the operation by division (flat-field correction) is preferred because the technique yields images that are photometrically more accurate. The primary reason for this difference is that images result from light amplitude values derived by a multiplicative process that combines the luminous flux and exposure time. After application of flat-field correction techniques (but not necessarily background subtraction algorithms), the relative amplitudes of specimen features will be photometrically accurate. As an added benefit, flat-field correction removes a majority of the optical defects that are present in the raw image.
Image Integration
Because a digital image is composed of a matrix of integers, operations such as the summation or integration of images can readily be conducted at high speed. If the original images were digitized with 8-bit resolution, the storage region, or digital frame memory, which holds the accumulated images, must have sufficient capacity to accommodate a sum that exceeds 8 bits. If it is assumed that a few pixels in an 8-bit digital image have the maximum gray-level value of 255, then summation of 30 frames would result in a local pixel gray-level value of 7650 and require a storage register with 13-bit capacity. To sum 256 frames, the storage capacity must equal 65,536 gray levels, or 16 bits, to accommodate the brightest pixels.
Although modern computer monitors are capable of displaying images having more than 256 gray levels, the limited response of the human eye (35-50 gray levels) suggests that 16-bit digital images should be scaled to match the limitations of the display and human visual ability. When the useful information of the image resides only in a subregion of the 16-bit stored image, only this portion should be displayed. This is a beneficial approach when displaying images captured by a slow-scan CCD camera of a viewfield with a large intrascene range of intensities. The process involves searching through the 16-bit image for the visually meaningful portion.
When images obtained with a video-rate analog or CCD camera are summed into a 16-bit frame memory, display of a meaningful 8-bit image is usually accomplished by dividing the stored sum by a constant. For example, a 96-frame summation of a viewfield can be divided by 96, 64, 32, or 24. Division by 32 is equivalent to a threefold increase in gain and results in utilization of the full 255 gray-level range. However, division by 24 is equivalent to a fourfold gain increase and results in image saturation and loss of information.
Image integration using digital image processing techniques often enables visualization of a faint object that is barely detectable above the camera noise. Integration may be of particular value in low-light-level imaging when the brightness of the image cannot be increased by additional image intensification. However, it is important to realize that, from signal-to-noise considerations, integration directly on the sensor is always preferable to integration in the processing software. Each image integration step in the software introduces analog-to-digital noise as well as camera readout noise.
Digital Image Histogram Adjustment
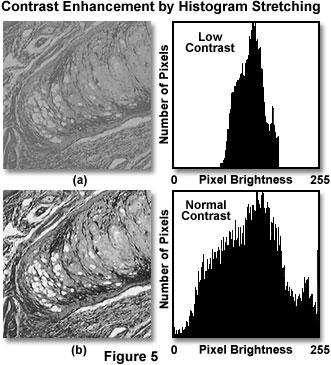
A majority of the digital images captured in an optical device, such as a camera or microscope, require adjustments to either the look-up table or the image histogram to optimize brightness, contrast, and general image visibility. Histograms of digital images provide a graphical representation of image contrast and brightness characteristics, and are useful in evaluating contrast deficiencies such as low or high contrast, and inadequate dynamic range. An image histogram is a graphical plot displaying input pixel values on the x-axis (referred to as a bin) versus the number (or relative number) of pixels for any given bin value on the y axis. Each bin in a grayscale histogram depicts a subgroup of pixels in the image, sorted by gray level. The numeric range of input values, or bins, on the x-axis usually corresponds to the bit depth of the captured image (0-255 for 8-bit images, 0-1023 for 10-bit images, and 0-4095 for 12-bit images). Mathematical operations may be performed on the histogram itself to alter the relative distribution of bins at any gray level. Manipulation of the histogram can correct poor contrast and brightness to dramatically improve the quality of digital images.
| Interactive Tutorial | |||||||||||
|
|||||||||||
Histogram stretching involves modifying the brightness (intensity) values of pixels in the image according to a mapping function that specifies an output pixel brightness value for each input pixel brightness value (see Figure 5). For a grayscale digital image, this process is straightforward. For an RGB color space digital image, histogram stretching can be accomplished by converting the image to a hue, saturation, intensity (HSI) color space representation of the image and applying the brightness mapping operation to the intensity information alone. The following mapping function is often utilized to compute pixel brightness values:
In the above equation, the intensity range is assumed to lie between 0.0 and 1.0, with 0.0 representing black and 1.0 representing white. The variable B represents the intensity value corresponding to the black level, while the intensity value corresponding to the white level is represented by the variable W. In some instances, it is desirable to apply a nonlinear mapping function to a digital image in order to selectively modify portions of the image.
Histogram equalization (also referred to as histogram leveling) is a related technique, which results in the reassignment of pixel gray-level values so that the entire range of gray levels is utilized and the number of counts per bin remains constant. The process yields a flat image histogram with a horizontal profile that is devoid of peaks. Pixel values are reassigned to ensure that each gray level contains an equal number of pixels while retaining the rank order of pixel values in the original image. Equalization is often utilized to enhance contrast in images with extremely low contrast where a majority of the pixels have nearly the same value, and which do not respond well to conventional histogram stretching algorithms. The technique is effective in treating featureless dark, and flat-field frames, and to rescue images with low-amplitude gradients. In contrast, histogram stretching spaces gray-level values to cover the entire range evenly. The auto-enhance or automatic levels (contrast) features of many image processing software packages utilize one of these histogram-based transformations of the image.
Digital image histograms can be displayed in several motifs that differ from the conventional linear x and y plots of pixel number versus gray level value. Logarithmic histograms chart the input pixel value on the x-axis versus the number of pixels having that value on the y-axis, using a log scale. These histograms are useful to examine pixel values that comprise a minority of the image, but exhibit a strong response to histogram stretching. Another commonly employed variation, the integrated or cumulative histogram, plots input pixel values on the x-axis and the cumulative number of all pixels having a value of x, and lower, on the y-axis. Cumulative histograms are often utilized to adjust contrast and brightness for images gathered in phase contrast, DIC, and brightfield illumination modes, which tend to have light backgrounds.
In some cases, images have regions of very high intensity, manifested by large peaks near the histogram 255 gray level, where the video signal is saturated and all pixels have been rendered at the maximum gray value. This situation is termed gray-level clipping and usually indicates that a certain degree of detail has been lost in the digital image because some regions of the original image that might have different intensities have each been assigned to the same gray value. Clipping of the histogram may be acceptable in some circumstances if detail is lost only from unimportant parts of the image. Such a situation might occur, for example, if the system has been adjusted to maximize the contrast of stained histological slides under brightfield illumination, with the clipping occurring only in bright background regions where there is no cellular structure.
Spatial Convolution Kernels (or Masks)
Some of the most powerful image processing tools utilize multipixel operations, in which the integer value of each output pixel is altered by contributions from a number of adjoining input pixel values. These operations are classically referred to as spatial convolutions and involve multiplication of a selected set of pixels from the original image with a corresponding array of pixels in the form of a convolution kernel or convolution mask. Convolutions are mathematical transformations of pixels, carried out in a manner that differs from simple addition, multiplication, or division, as illustrated in Figure 6 for a simple sharpening convolution kernel mask.
In the simplest form, a two-dimensional convolution operation on a digital image utilizes a box convolution kernel. Convolution kernels typically feature an odd number of rows and columns in the form of a square, with a 3 x 3 pixel mask (convolution kernel) being the most common form, but 5 x 5 and 7 x 7 kernels are also frequently employed. The convolution operation is performed individually on each pixel of the original input image, and involves three sequential operations, which are presented in Figure 6. The operation begins when the convolution kernel is overlaid on the original image in such a manner that the center pixel of the mask is matched with the single pixel location to be convolved from the input image. This pixel is referred to as the target pixel.
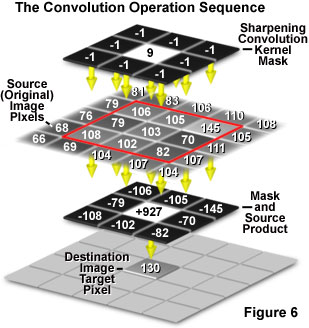
Next, each pixel integer value in the original (often termed the source) image is multiplied by the corresponding value in the overlying mask (Figure 6). These products are summed and the grayscale value of the target pixel in the destination image is replaced by the sum of all the products, ending the operation. The convolution kernel is then translocated to the next pixel in the source image, which becomes the target pixel in the destination image, until every pixel in the original image has been targeted by the kernel.
Convolution kernels may contain all positive, or positive and negative values, and thus can result in negative totals, or results that exceed the maximum 255 limit that a pixel can hold. Appropriate divisor and offset values are needed to correct this. The smoothing convolution kernel illustrated in Figure 7(a) has a value of unity for each cell in the matrix, with a divisor value of 9 and an offset of zero. Kernel matrices for 8-bit grayscale images are often constrained with divisors and offsets that are chosen so that all processed values following the convolution fall between 0 and 255. Many of the popular software packages have user-specified convolution kernels designed to fine-tune the type of information that is extracted for a particular application.
| Interactive Tutorial | |||||||||||
|
|||||||||||
Convolution kernels are useful for a wide variety of digital image processing operations, including smoothing of noisy images (spatial averaging) and sharpening images by edge enhancement utilizing Laplacian, sharpening, or gradient filters (in the form of a convolution kernel). In addition to convolution operations, local contrast can be adjusted through the application of maximum, minimum, or median filters that rank the pixels within each local neighborhood. Furthermore, the use of a Fourier transform to convert images from the spatial to the frequency domain makes possible another class of filtering operations. The total number of algorithms developed for image processing is enormous, but several operations enjoy widespread application among many of the popular image processing software packages.
Smoothing Convolution Filters (Spatial Averaging)
Specialized convolution kernels, often termed smoothing filters, are often used for reducing random noise in digital images. A typical smoothing convolution filter is illustrated in Figure 7(a), and is essentially a matrix having an integer value of 1 for each row and column. When an image is convolved with this type of kernel, the gray value of each pixel is replaced by the average intensity of its eight nearest neighbors and itself. Random noise in digital images is manifested by spurious pixels having unusually high or low intensity values. If the gray value of any pixel overlaid by the convolution kernel is dramatically different than that of its neighbors, the averaging effect of the filter will tend to reduce the effect of the noise by distributing it among all of the neighboring pixels.
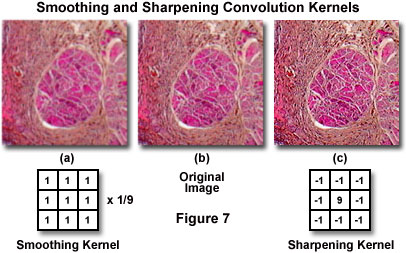
The nine integers in each smoothing kernel illustrated in Figure 7 add to a value of 1 when summed and divided by the number of values in the matrix. These kernels are designed so that the convolution operation will produce an output image having an average brightness that is equal to that of the input images (however, in some cases, this may be only approximate). In general, the sum of terms in most convolution kernels will add to a value between zero and one in order to avoid creating an output image having gray values that exceed the dynamic range of the digital-to-analog converter utilized to display the image.
Smoothing convolution kernels act as low-pass filters to suppress the contribution of high spatial frequencies in the image. The term spatial frequency is analogous to the concept of frequency with respect to time (temporal frequency), and describes how rapidly a signal changes with respect to position in the image. A low spatial frequency might exhibit only a few cycles across the width of an image, while a high spatial frequency often displays numerous cycles in the same linear dimensions. An excellent example is the minute orderly arrays of miniature pores and striae exhibited by diatom frustules, which alternate between very high and low intensities over very short distances. A low spatial frequency might exhibit only a few cycles across the width of an image (manifested as widely spaced stripes, for example), whereas a high spatial frequency undergoes numerous cycles across the lateral dimensions of an image. The highest spatial frequency that can be displayed in a digital image has a period equal to the width of two pixels.
| Interactive Tutorial | |||||||||||
|
|||||||||||
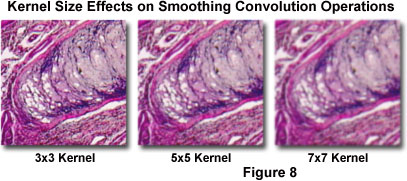
The type of random noise typically observed in digital images has a high spatial frequency that can be effectively removed by applying a smoothing convolution kernel to the image, pixel by pixel. However, other "real" image features that are desirable, such as object boundaries and fine structural details, may also have high spatial frequencies that can unfortunately be suppressed by the smoothing filter. Consequently, application of a smoothing convolution kernel will often have the undesirable effect of blurring an input image. Furthermore, the larger the kernel (5 x 5, 7 x 7, and 9 x 9), the more severe this blurring effect will be (Figure 8). For most applications, the size and form of the smoothing kernel must be carefully chosen to optimize the tradeoff between noise reduction and image degradation. A Gaussian filter is a smoothing filter based on a convolution kernel that is a Gaussian function, and provides the least amount of spatial blurring for any desired amount of random noise reduction. Smoothing filters are good tools for making simple cosmetic improvements to grainy images that have a low signal-to-noise ratio, but these filters can also undesirably reduce the image resolution as a consequence.
Sharpening Convolution Filters
In direct contrast to the action of smoothing convolution filters, sharpening filters are designed to enhance the higher spatial frequencies in a digital image, while simultaneously suppressing lower frequencies. A typical 3 x 3 convolution mask and its effect on a digital image captured with an optical microscope is illustrated in Figure 7(c). In addition to enhancing specimen boundaries and fine details, sharpening filters also have the effect of removing slowly varying background shading. Thus, these filters can sometimes be utilized to correct for shading distortion in an image without having to resort to background subtraction algorithms. Unfortunately, sharpening convolution filters have the undesirable effect of enhancing random noise in digital images.
The kernel size can be adjusted to optimize the effects of sharpening filters and to fine-tune the masks to operate on a specific range of spatial frequencies. A typical 3 x 3 mask (see Figures 6 and 7) has the greatest effect on image features that vary over the spacing interval of a single pixel. Doubling or tripling the size of the kernel will target lower spatial frequencies that extend over two or more pixels.
Median Filters
Median filters are primarily designed to remove image noise, but are also very effective at eliminating faulty pixels (having unusually high or low brightness values) and reducing the deterioration caused by fine scratches. These filters are often more effective at removing noise than smoothing (low pass) convolution kernels. Median kernels are applied in a manner that is different from standard smoothing or sharpening kernels. Although the median filter operates in a local neighborhood that is translated from pixel to pixel, there is no convolution matrix applied. At each successive pixel location, the pixels under scrutiny are ordered in rank according to their intensity magnitude. A median value is then determined for all of the pixels covered by the neighborhood, and that value is assigned to the central pixel location in the output image.
Median filters are useful for removing random intensity spikes that often occur in digital images captured in the microscope. Pixels contributing to the spike are replaced with the median value of the local neighborhood pixels, which produces a more uniform appearance in the processed image. Background regions that contain infrequent intensity spikes are rendered in a uniform manner by the median filter. In addition, because the median filter preserves edges, fine specimen detail, and boundaries, it is often employed for processing images having high contrast.
Specialized Convolution Filters
Derivative filters provide a quantitative measurement for the rate of change in pixel brightness information present in a digital image. When a derivative filter is applied to a digital image, the resulting data concerning brightness fluctuation rates can be used to enhance contrast, detect edges and boundaries, and to measure feature orientation. One of the most important derivative filters is the Sobel filter, which combines two orthogonal derivatives (produced by 3 x 3 kernel convolutions) to calculate the vector gradient of brightness. These convolutions are very useful for edge enhancement of digital images captured in the microscope. Edges are usually one of the most important features in a microscopic structure, and can often be utilized for measurements after appropriate enhancement algorithms have been applied.
Laplacian filters (often termed operators) are employed to calculate the second derivative of intensity with respect to position and are useful for determining whether a pixel resides on the dark or light side of an edge. The Laplacian enhancement operation generates sharp peaks at the edges, and any brightness slope, regardless of whether it is positive or negative, is accentuated, bestowing an omnidirectional quality to this filter. It is interesting to note that in the human visual system, the eye-brain network applies a Laplacian-style enhancement to every object in the viewfield. Human vision can be simulated by applying a Laplacian-enhanced image to the original image, using a dual-image point process, to produce a modified image that appears much sharper and more pleasing.
An important issue that arises within the convolution process methodology centers on the fact that the convolution kernel will extend beyond the borders of the image when it is applied to border pixels. One technique commonly utilized to remedy this problem, referred to as centered, zero boundary superposition, is simply to ignore the problematic pixels and to perform the convolution operation only on those pixels that are located at a sufficient distance from the borders. This method has the disadvantage of producing an output image that is smaller than the input image. A second technique, called centered, zero padded superposition, involves padding the missing pixels with zeroes. Yet a third technique regards the image as a single element in a tiled array of identical images, so that the missing pixels are taken from the opposite side of the image. This method is called centered, reflected boundary superposition and has the advantage of allowing for the use of modulo arithmetic in the calculation of pixel addresses to eliminate the need for considering border pixels as a special case. Each of these techniques is useful for specific image-processing applications. The zero padded and reflected boundary methods are commonly applied to image enhancement filtering techniques, while the zero boundary method is often utilized in edge detection and in the computation of spatial derivatives.
Unsharp Mask Filtering
Unsharp mask algorithms operate by subtraction of a blurred image from the original image, followed by adjustment of gray level values in the difference image. This operation enables preservation of high-frequency detail while allowing shading correction and background suppression. The popular technique is an excellent vehicle to enhance fine specimen detail and sharpen edges that are not clearly defined in the original image. The first step in an unsharp mask process is to produce a slight blur (by passage through a Gaussian low-pass filter) and a reduction in amplitude of the original image, which is then subtracted from the unmodified original to produce a sharpened image. Regions in the image that have uniform amplitude are rendered in a medium gray brightness level, whereas regions with larger slopes (edges and boundaries) appear as lighter or darker gradients.
| Interactive Tutorial | |||||||||||
|
|||||||||||
In general, unsharp mask filters operate by subtracting appropriately weighted segments of the unsharp mask (the blurred original) from the original image. Such a subtraction operation enhances high-frequency spatial detail at the expense (attenuation) of low-frequency spatial information in the image. This effect occurs because high-frequency spatial detail removed from the unsharp mask by the Gaussian filter is not subtracted from the original image. In addition, low-frequency spatial detail that is passed by the Gaussian filter (to the unsharp mask) is almost entirely subtracted from the original image. Increasing the size of the Gaussian filter allows the smoothing operation to remove larger size detail, so that those details are retained in the difference image.
One of the primary advantages of the unsharp mask filter over other sharpening filters is the flexibility of control, because a majority of the other filters do not provide any user-adjustable parameters. Like other sharpening filters, the unsharp mask filter enhances edges and fine detail in a digital image. Because sharpening filters also suppress low frequency detail, these filters can be used to correct shading distortion throughout an image that is commonly manifested in the form of slowly varying background intensities. Unfortunately, sharpening filters also have the undesirable side effect of increasing noise in the filtered image. For this reason, the unsharp mask filter should be used conservatively, and a reasonable balance should always be sought between the enhancement of detail and the propagation of noise.
Fourier Transforms
The Fourier transform is based on the theorem that any harmonic function can be represented by a series of sine and cosine functions, differing only in frequency, amplitude, and phase. These transforms display the frequency and amplitude relationship between the harmonic components of the original functions from which they were derived. The Fourier transform converts a function that varies in space to another function that varies with frequency. It should also be noted that the highest spatial frequencies of the original function are found the farthest away from the origin in the Fourier transform.
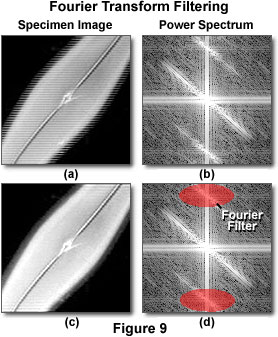
Spatial filtering involving Fourier techniques can be utilized to manipulate images through deletion of high or low spatial-frequency information from an image by designing a Fourier filter that is nontransmitting at the appropriate frequency. This technique is especially useful for removing harmonic noise from an image such as the herringbone or sawtooth patterns often apparent in video images (see Figure 9). Because the added noise is harmonic, it will be found in localized discrete regions of the Fourier transform. When these local peaks are removed from the transform with the appropriate filter, the re-formed image is essentially unaltered except that the offending pattern is absent. Similar filtering techniques can also be applied to remove sine wave, moir�, halftone, and interference patterns, as well as noise from video signals, CCDs, power supplies, and electromagnetic induction.
Illustrated in Figure 9(a) is a video image of a diatom frustule imaged in darkfield illumination with a superimposed sawtooth interference pattern. Adjacent to the diatom image (Figure 9(b)) is the Fourier transform power spectrum for the image, which contains the spatial frequency information. After applying several filters (Figure 9(d)) and re-forming the image, the sawtooth pattern has been effectively eliminated (Figure 9(c)), leaving only the image of the frustule.
| Interactive Tutorial | |||||||||||
|
|||||||||||
The decision as to whether to utilize Fourier filtering or convolution kernel masks depends on the application being considered. The Fourier transform is an involved operation that takes more computer horsepower and memory than a convolution operation using a small mask. However, the Fourier filtering technique is generally faster than the equivalent convolution operation, especially when the convolution mask is large and approaches the size of the original image. Appropriate choice of equivalent Fourier and convolution operations may reduce the complexity of their respective masks. For example, a simple Fourier filter, such as one designed to remove harmonic noise, would produce a large and complex convolution mask that would be difficult to use.
Another useful feature of the Fourier transform stems from its relationship to the convolution operation, which involves several multiplication and addition operations, according to the contents of the convolution mask, to determine the intensity of each target pixel. This operation can be compared to Fourier filtering, where each value in the Fourier filter is simply multiplied by its corresponding pixel in the Fourier transform of an image. The two operations are related because the convolution operation is identical to the Fourier filtering operation when the Fourier filter is the Fourier transform of the convolution mask. This equivalence indicates that either of these two techniques can be employed to obtain identical results from an image, depending only on whether the operator decides to work in image space or Fourier space.
Conclusions
Digitization of a video or CCD-generated electronic image captured with the microscope results in a dramatic increase in the ability to enhance features, extract information, or modify the image. The extent of the increased processing power of the digital approach may not be appreciated at first glance, particularly in comparison to the older and apparently simpler analog methods, such as traditional photomicrography on film. In fact, digital image processing enables reversible, virtually noise-free modification of an image as a matrix of integers instead of as a series of time-dependent voltages or, even more primitively, using a photographic enlarger in the darkroom.
Much of the recent progress in high-resolution transmitted optical microscopy and low-light-level reflected fluorescence microscopy of living cells has relied heavily on digital image processing. In addition, most confocal and multiphoton microscopes depend strictly on high-speed, high fidelity digitization of the scanned image, and on the subsequent digital manipulation of the viewfield to be displayed. Newer microscope designs lacking eyepieces (oculars) and coupled directly to image capture software also depend on image processing technology to produce high-quality digital images from the microscope.
The power of digital image processing to extract information from noisy or low-contrast images and to enhance the appearance of these images has led some investigators to rely on the technology instead of optimally adjusting and using the microscope or image sensor. Invariably, beginning with a higher-quality optical image, free of dirt, debris, noise, aberration, glare, scratches, and artifacts, yields a superior electronic image. Careful adjustment and proper calibration of the image sensor will lead to a higher-quality digital image that fully utilizes the dynamic range of both the sensor and the digital image processing system.
Contributing Authors
Kenneth R. Spring - Scientific Consultant, Lusby, Maryland, 20657.
John C. Russ - Materials Science and Engineering Department, North Carolina State University, Raleigh, North Carolina, 27695.
Michael W. Davidson - National High Magnetic Field Laboratory, 1800 East Paul Dirac Dr., The Florida State University, Tallahassee, Florida, 32310.
BACK TO DIGITAL IMAGING IN OPTICAL MICROSCOPY