MULTIPLE LIQUID CRYSTAL PHASES
OF DNA AT HIGH CONCENTRATIONS
Teresa E. Strzelecka
Michael W. Davidson & Randolph L. Rill
Department of Chemistry
and Institute of Molecular Biophysics
The Florida State University
Tallahassee, Florida 32306-3006, USA
DNA packaging in vivo is very tight, with volume concentrations approaching 70% w/v in sperm heads, virus capsids and bacterial nucleoids1-3. The packaging mechanisms adopted may be related to the natural tendency of semi-rigid polymers to form liquid crystalline phases in concentrated solutions4-8. We find that DNA forms at least three distinct liquid crystalline phases at concentrations comparable to those in vivo, with phase transitions occurring over relatively narrow ranges of DNA concentration. A weakly birefringent, dynamic, `precholesteric' mesophase with microscopic textures intermediate between those of a nematic and a true cholesteric phase forms at the lowest concentrations required for phase separation. At slightly higher DNA concentrations, a second mesophase forms which is a strongly birefringent, well-ordered cholesteric phase with a concentration-dependent pitch varying from 2 to 10 µm. At the highest DNA concentrations, a phase forms which is two-dimensionally ordered and resembles smectic phases of thermotropic liquid crystals observed with small molecules.
Although specialized proteins are involved in many DNA packaging processes descriptions of mechanisms of DNA packaging must also consider the intrinsic tendency of the stiff DNA chain to fold when confined to a small volume. Stiff nonelectrolyte polymers form highly ordered, liquid crystalline phases above a critical concentration dependent on the persistence length4-8. Formation of nematic or cholesteric liquid crystalline phases by semi-rigid polymers, such as polybenzyl-L-glutamate, in organic solvents has been studied in detail7,8, and was predicted theoretically by Onsager4, Flory5,6 and others. Much less is known about the behavior of semi-rigid polyelectrolytes. Because DNA, fibrous proteins and certain polysaccharides are polyelectrolytes involved in numerous supramolecular associations in vivo, an understanding of the phase behavior of these biopolymers is of fundamental biological importance.
Ordering of semi-rigid polymers at high concentrations occurs spontaneously to minimize the macromolecular excluded volume4-8. Semi-rigid polyelectrolyte behavior is complicated by charge-shielding requirements. A strong polyelectrolyte is surrounded by a counterion layer, which determines the effective axial ratio and excluded volume9-13. Because polymer phase behavior depends on the effective polymer dimensions, the critical concentration for DNA ordering is a sensitive function if ionic strength and counterion type.
|
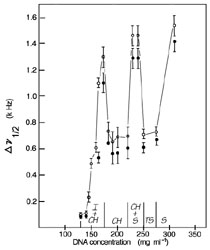
Dependence of solid state 31P NMR linewidth on DNA concentration suggesting multiple phase transitions. DNA fragments of average length 146 base pairs (~500 Å) and with a narrow distribution about this length were prepared by digestion with micrococcal nuclease of calf-thymus chromatin previously depleted of histone H1, and by subsequent deproteinization16. Short DNA molecules are studied as a preliminary step to understanding the natural behavior of DNA at in vivo concentrations. Such defined samples are useful because effects of relative molecular mass heterogeneity are minimized and phase transitions are sharp and kinetically rapid. Using DNA fragments of this size is appropriate because the driving forces are the same for ordering of high axial ratio, rod-like molecules and long semi-flexible polymers of identical composition5,6. Open circles: data taken at 30ºC; filled circles: data taken at 50ºC. Spectra were obtained on non-spinning samples at a phosphorus frequency of 61.3 MHz on the `Seminole', an in-house constructed multinuclear Fourier transform (FT) spectrometer equipped with wide-bore superconducting solenoid and quadrature detection, modified for solid-state applications. Sweep width was ±25 kHz, pulse repetition times were 3 s, and 600 scans were added for each spectrum. Gated proton decoupling was applied during data acquisition. |
Previous studies demonstrated that aqueous solutions of persistence length DNA (~500 Å), with 0.3 M NaCl as the supporting electrolyte, form biphasic liquid crystalline solutions containing spherulites at DNA concentrations (CDs) of 130-170 mg DNA ml-1 at room temperature, and become fully liquid crystalline at higher CD (refs 14-16). Phase transition boundaries were in good agreement with predicted rigid rod behavior when DNA was treated as a scaled rod with an effective radius of 21.5 Å at this ionic strength16. Here we report the phase behavior when DNA solutions over a range of CDs from 100 to 350 mg DNA ml-1, as determined by solid-state 31P NMR spectroscopy, polarized light microscopy and by electron microscopy.
Solutions showed a uniform liquid crystalline phase at CDs from 170 to 220 mg ml-1. A CD of 170-mg ml-1 corresponds to an effective DNA volume fraction of 0.76, assuming 21.5 Å for the effective DNA radius16. Extrapolation to higher CDs yields an apparent effective volume fraction > 1.0 for CDs exceeding ~230 mg ml-1. As DNA solutions were prepared with CDs over 300-mg ml-1, there must be mechanisms for reducing the effective DNA volume fraction.
Three potential mechanisms for reducing the effective DNA volume are evident: (1) a change to a more ordered phase, (2) a contraction of the counterion layer, or (3) a change in DNA confirmation/hydration. A phase change above CDs of 220-mg ml-1 was indicated by a change in 31P resonance linewidth and shape(Fig. 1). At lower CDs, in the biphasic region, the resonance linewidth increased progressively with CD until the solution became fully liquid-crystalline, then dramatically sharpened. Concurrently, the lineshape changed from lorenzian to an asymmetric form excepted from an aligned sample with some rotational averaging. Magnetic alignment of liquid crystalline DNA phases with the long molecular axes perpendicular to the field was reported eviously16,17.
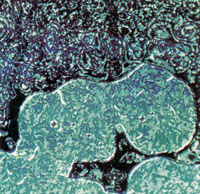
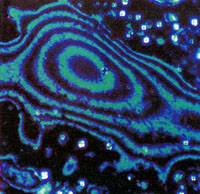
Figure 2(a&b)

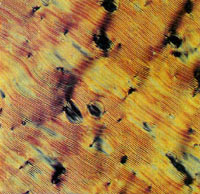
Figure 2(c&d)
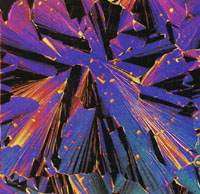
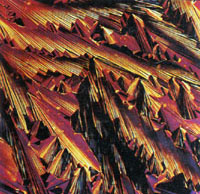
Figure 2(e&f)
| Fig. 2 Multiple liquid crystalline DNA phases observed by polarized light microscopy. A sample of 100-mg ml-1 DNA in 0.25-M ammonium acetate was placed on a slider under a partially sealed coverslip so that slow evaporation created a continuous concentration gradient. Samples were observed through crossed polarizers with a Nikon Optiphot-Pol microscope under 3,200 K tungsten-halide illumination and photographed on Fujichrome 64-T professional film. a,c, Low magnification views illustrating sharp transition zones between precholesteric and cholesteric domains (a) and between cholesteric and smectic-like domains(c). Magnification ~ x 40. b,d-f, Higher magnification views of the three major phases. b, Weakly birefringent, diffuse ring texture of `precholesteric' phase. d, Highly birefringent, fringe or chevron texture of magnetically aligned cholesteric phase. e, Focal-conic-fan texture of smectic-like phase. f, `Pleated ribbon' texture of most concentrated smectic-like phase near open end of coverslip. Magnifications ~ x 100 in b,e,f; x 200 in d |
Magnetic alignment of the mesophase in a biphasic solution is prevented because surface tension restricts the mesophase to spherulites in which DNA molecules are oriented tangentially to the spherical surface18. By analogy, we attribute lineshape changes at CDs slightly above 220-mg ml-1 to formation of a biphasic solution in which two liquid-crystalline phases coexist. Magnetic alignment may be ineffective because of dynamic exchange of molecules between phases with different alignment properties. This conclusion was enforced by the behavior at yet higher CDs (Fig 1). The resonance remained broad at CDs from 229 to 240 mg ml-1, then narrowed again at CDs of 250 and 275-mg ml-1, suggesting formation of a second uniform, aligned phase. Resonance broadening indicative of another phase transition was again observed at a CD of 309-mg ml-1.
Interpretations of lineshape changes in terms of phase transitions were supported by microscope examination. Liquid-crystalline phases are traditionally characterized by their microscopic textures as observed through crossed polarizers19-21. Cholesteric liquid crystals, in which the long axes of the molecules lie in pseudo-planes that are slightly twisted with respect to each other, have periodic variations in refractive index and fringe patterns with spacing of P/2, where P is the cholesteric pitch. Many smectic liquid crystals show focal-conic fan textures due to ordering in a second dimension, and can be easily distinguished from nematic or cholesteric forms20,21.
Three distinct phases were observed simultaneously by placing a 100mg DNA ml-1 sample on a slide and partially sealing the coverslip, allowing slow evaporation to create a gradient in CD across the slide (Fig. 2 a,c). The low CD mesophase was weakly birefringent and gave roughly circular patterns of broad alternating light and dark lines when viewed through crossed polarizers (Fig. 2 a,b). Rapid, small-scale changes in birefringence due to fluctuations in the nematic director were noted at high magnification (x400). The weak birefringence and director fluctuations imply a dynamic character of this phase. Thicker specimens of this phase had an `oily streak' texture and could be magnetically aligned, but were easily perturbed when removed from the field.
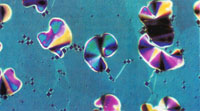
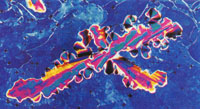
Figure 3(a&b)
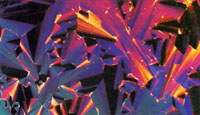
Figure 3(c)
| Fig. 3 Evolution of the smectic-like phase. A 350-mg DNA ml-1 sample in 0.25-M ammonium acetate, when first applied to a slide and coverslipped exhibited a mottled planar texture typical of a homoeotropic alignment. Small batonnets formed within 1-h (a) and enlarged (b), eventually merging to form a classical focal-conic-fan texture (c). Microscopy and photography as in Fig. 2. Magnification ~ x 125. |
We tentatively refer to the first mesophase as a `precholesteric' phase. A weakly birefringent precholesteric mesophase in moderately concentrated samples of high relative molecular mass DNA was recently reported19. The textures of the latter phase were attributed to a three-dimensional helicoidal arrangement of DNA molecules somewhat analogous to the molecular arrangement in blue phases of small molecules. Microscopic textures we observed for the precholesteric phase of short DNA were unlike those reported19, suggesting that evolution of DNA phases may be molecular-length dependent.
The periodic fringe and `oily streak' textures of the first mesophase are reminiscent of a cholesteric phase, but they differed significantly from the classical cholesteric textures of the intermediate DNA mesophase, which was highly birefringent with very regular, finely spaced fringe patterns and was extensively aligned in a magnetic field (Fig. 2d). Freeze-fracture-etch electron microscopy and optical diffraction studies have confirmed that this intermediate phase is, in fact, cholesteric (M.W. Davidson and R. L. Rill, manuscript in preparation).
Smectic phases have two-dimensional order, with the molecules arranged in planes at a defined angle to the preferred orientation direction of the long molecular axes. There are two common `natural' textures of smectic a and several other smectic phases-a uniform, homeotropic texture with molecules oriented nearly perpendicular to the slide surface, and the focal-conic fan texture20,21. Focal-conic and striated fan textures were observed for the highest concentration mesophase (s) in controlled drying experiments (Fig. 2 c,e, and f). Close examination of a 350 mg DNA ml-1 sample confirmed that DNA forms a mesophase with molecular layering resembling that found in smectic phases of small molecules.
Specimens observed immediately after placement on a slide usually exhibited a nearly uniform homeotropic texture. Batonnets initiated after a few hours, enlarged, and eventually merged to yield a classical focalconic fan texture (Fig. 3). Examination in the electron microscope of freeze-fracture-etch replicas confirmed that DNA molecules were arranged in layers, and that the long molecular axes were approximately perpendicular to the layer planes (Fig. 4). More definitive data are required to unambiguously relate this DNA phase to conventional smectics.
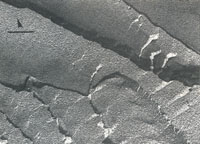
Figure 4
| Fig. 4 Freeze-fracture-etch electron microscopy illustrating the layered structure of the smectic-like, high concentration DNA phase. Low magnification view shows cleavage `steps' (scale bar, 1µm). The direction of shadowing is indicated by the arrow. DNA molecules appear to lie `end-on' to the viewer and approximately perpendicular to the layer planes, as expected for a smectic phase. The `end-on' view is readily distinguished from `side-on' views obtained on examination of cholesteric phases, which tend to shear across cholesteric planes (M.W. Davidson and R. L. Rill, unpublished observations). Samples were placed on gold grids, quick frozen between gold planchets using propane jets, fractured at -120ºC, etched at-100ºC for 2 min, and platinum-carbon shadowed at 45ºC (Balzers BAE 360). Micrographs of replicas were obtained on a Jeol 100CX in transmission mode at 80 kV acceleration voltage. |
Using light and electron microscopy we observed several other textures in samples of ~300-400 mg ml-1 (for example, compare Fig. 2 e,f), suggesting the existence of other higher-order phases. As DNA is chiral and packs hexagonally in crystals22, chiral phases could form which are analogous to the chiral smectic C phase, or to more ordered chiral hexatic phases of small molecules (for example, chiral smectic G or I (refs 20,21). These observations demonstrate that DNA in vitro can assume multiple-packing arrangements, which can be readily altered over small ranges of concentration. We expect that the phase behavior of DNA in vitro will also be a sensitive function of the ionic environment. Significant modulation of DNA packing in vivo may be accomplished by small changes in DNA concentration of counterion atmosphere. Similar principles may apply to the ordering of other biological polyelectrolytes.
We thank Dr. Henry Aldrich of the University of Florida for assistance with freeze-fracture-etch methods and Drs. David Van Winkle and Francoise Livolant for advice on liquid crystal theory. This work was supported in part by the NIH.
REFERENCES
1. Du Praw, E.J. DNA and Chromosomes (Holt, Rinehart & Winston, New York, 1970).
2. Earnshaw, W.C. & Casjens, S.R. Cell 21, 319-331 (1980).
3. Sipski, W. & Wagner, T.E. Biopolymers 16, 573-582 (1977).
4. Onsager, L. Ann. N.Y. Acad. Sci.51, 627-659 (1949).
5. Flory, P.J. Proc. R. Soc. A234, 60-89 (1956).
6. Flory, P.J. in Polymer Liquid Crystals (eds. Ciferri, A., Krigbaum, W.R. & Meyer, R.B.) 103-112 (Academic, New York, 1982).
7. Robinson, C. Trans Faraday Soc. 52, 571-592 (1956).
8. Miller, W.A. Rev. Biophys. 29, 519-535 (1979).
9. Manning, G.S.Q. Rev. Biophys. 11, 170-246 (1978).
10. Stigter, D. Biopolymers 16, 1435-1448 (1977).
11. Stigter, D. J. phys. Chem. 82, 1603-1606 (1978).
12. Brian, A.A., Frisch, H.L. & Lerman, L. S. Biopolymers 20, 1305-1328 (1981).
13. LeBret, M. & Zimm, B. H. Biopolymers 23, 271-285 & 286-312 (1984).
14. Rill, R. L., Hilliard, P.R. & Levy, G.C. J. biol. Chem. 258, 250-256 (1983).
15. Rill, R.L. Proc. natn. Acad. Sci. U.S.A. 83, 342-346 (1986).
16. Strzelecka, T. E. & Rill, R. L. J. Am. chem. Soc. 109, 4513-4518 (1987).
17.. Brandes, R. & Kearns, E. R. Biochemistry 25, 5890-5895 (1986).
18. Lerman, L.S. Cold Spring Harbor Symp. quant. Biol. 38, 59-74 (1974).
19. Livolant, F. J. Physique 48, 1051-1066 (1987).
20. Demus, D. & Richter, L. Textures of Liquid Crystals (Verlag Chemie, New York, 1978).
21.Gray, G.W. & Goodby, J.W.G. Smectic Liquid Crystals (Heyden, Philadelphia, 1984).
22. Lerman, L.S. Wilkerson, L.S., Venable, J.H. J. molec. Biol. 108, 271-293 (1976).