PHOTOMICROGRAPHY IN THE
GEOLOGICAL SCIENCES
Michael W. Davidson
Institute of Molecular Biophysics
Center for Materials Research and Technology (MARTECH)
National High Magnetic Field Laboratory (NHMFL)
Supercomputer Computations Research Institute (SCRI)
Florida State University, Tallahassee, Florida 32306
Telephone: 850-644-0542 Fax: 850-644-8920
Gary E. Lofgren
Planetary Materials Branch
Solar System Exploration Division
Code SN2
NASA Johnson Space Center
Houston, Texas 77058
Telephone: 713-483-6187 Fax: 713-483-2696
ABSTRACT
Microscopy plays a paramount role in the examination and identification of geological petrographic thin sections of rocks and minerals. A necessary responsibility of microscopy is to capture the images seen in the microscope onto photographic film to obtain "hard copy" for research records. In this article we describe the conversion of a standard biological brightfield microscope for examination of geological petrographic thin sections and characterize, in detail, the use of both black and white and color photomicrography in the geological sciences. Several illustrative examples on the use of transmitted and reflected polarized light microscopy to solve geological problems are presented.
INTRODUCTION
The biological and medical sciences have, for many years, relied heavily on visible light microscopy to solve problems relating to the gross morphological features of specimens as well as a quantitative tool for recording specific optical features and data. In this respect, the microscope has proven invaluable in countless investigations into the mysteries of life. Geologists have also employed light microscopy to examine petrographic thin sections of rocks and minerals found on earth and on the moon, and even meteorites from space. These geological studies have led to a detailed understanding of the origin and composition of our planet and its nearest neighbor.
In recent years, many new glass alloys have been discovered and lens fabrication technology has shown some dramatic improvements (Delly, 1988). Also, the development of advanced anti-reflection lens coatings has led to the production of new microscopes that are optically superior to those made in the past. To further enhance the capabilities of modern microscopes, manufacturers are now using photomultipliers to monitor light intensity for photomicrography. These photomultipliers are coupled to microprocessor-controlled exposure monitors that determine correct exposure times based on user settings for various photographic film characteristics. Advanced optical techniques such as cross-polarized illumination, differential interference contrast, and Rheinberg illumination have become standard features on many modern microscopes.
As improvements in the quality of visible light microscopes have developed, so have the applications. Microscopy is rapidly becoming a (main) staple in the scientific equipment inventory in such diverse disciplines as chemistry, engineering, geology, physics, materials sciences and even the semiconductor and computer industries. New materials that have come under the scrutiny of light microscopy include birefringent liquid crystalline systems (Saeva, 1979), high temperature ceramic superconductor thin-films (Feldman, 1986), synthetic chondrules in the study of chondritic meteorites (Lofgren, 1989), ceramic synthetic perovskites (Hazen, 1988), and integrated circuit surfaces (Davidson, 1991a; Silverman, 1987). The nature of these materials requires, in some instances, examination by reflected (episcopic) illumination that departs from the classical transmitted (diascopic) illumination techniques that have been so well developed in the biological and geological sciences.
Transmitted light microscopy is a mature discipline in which a wide spectrum of illumination techniques are available for contrast enhancement. For instance, living cells in tissue culture can be observed directly at amazingly high resolution using phase and differential interference contrast techniques. At high magnification, cellular internal features are clearly resolvable using these methods. In contrast, reflected light microscopy is just emerging as an important tool for investigating surface features in the materials and geological sciences. A significant commercial boost to reflected light microscopy has come from the semiconductor industry which relies heavily on this technique to capture microscopic details on integrated circuit wafers during the manufacturing process. The need for contrast-enhancement methods in reflected light microscopy has led to the development of reflected light differential interference contrast objectives that rival, in quality, their counterparts on the transmitted light microscope.
Photomicrography has enjoyed a recent escalation in popularity due, in part, to the introduction of new transparency films with improved emulsions that respond correctly to the color spectrum generated by tungsten-halide light bulbs found in most microscopes. Improved glass alloys and optical coatings, as described above, have enabled manufacturers to produce microscope objectives that will produce crisp images of better quality than has been previously possible. These developments, coupled to the widespread availability of microprocessor-assisted internal microscope exposure monitors have collectively been directly responsible for the increased activity in the field of visible light photomicrography. The growing interest in photomicrography is partially evidenced by the number of photomicrograph contests held each year both on a domestic and international basis (Davidson, 1990a). Geological and materials science samples continually win prizes in these contests dedicated to the advancement of art in science. Another indicator of the popularity of photomicrography is the increasing number of scientific trade journals and arbitrated scientific periodicals that feature photomicrographs on the front covers as an eye-catcher (For a list of periodicals that, in the past, have used photomicrographs on the cover, see Davidson, 1990b).
Computer-assisted image analysis and scanning confocal microscopy are surfacing as important techniques, however their high cost will prohibit their entry into the educational arena in the foreseeable future. While these techniques lie beyond the scope of this article, the interested reader is referred to excellent reviews on these exciting subjects (Inoue, 1986 and Pawley, 1989).
MICROSCOPE CONFIGURATION
The majority of microscopes found in educational institutions are of the transmitted light variety commonly used in biological laboratories. At a relatively low cost, these microscopes can be converted for use in the materials and geological sciences as well (Davidson 1991b; Brice and Lint, 1987; Singh, 1983; Hasson, 1975).
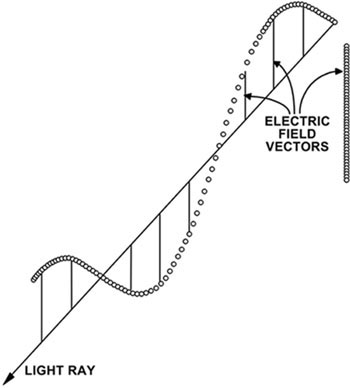
Most microscope light sources emit visible light that vibrates as a wave in all directions perpendicular to the optical axis of the microscope. When used in this fashion, the microscope is said to be operating in the brightfield mode. Visible light consists of an electric field vector component and a magnetic field vector component that are mutually perpendicular to each other and both are perpendicular to the direction of propagation of the light beam. The electric field interacts strongly with materials, so its direction and amplitude are used to describe the light. At any particular instant in time, the amplitude and direction of the electric field can be utilized to define a point on a plane that is perpendicular to the direction of the light beam.
|
Schematic illustration of the electric field vector showing several possible states of plane-polarized light where the vector remains in one plane. |
To an observer looking toward the light source, this point would trace out a curve as the field varied. If the curve is simple and repetitive, the light is said to be polarized and the form of the curve defines the state of polarization. If the curve is irregular and chaotic, the light is unpolarized. When the electric field oscillates in amplitude, but has a fixed direction, the curve traced out is a straight line and the field remains in one plane as illustrated in Figure 1. This is called the plane of polarization (Wahlstrom, 1979) and the light is defined as linear or plane-polarized.
In practice, polarized light can be produced by passing the beam through a specially prepared crystal of the mineral calcite (Iceland Spar) or through a Polaroid (r) polarizing element. Placing a polarizing element into the light path restricts the passage of light, much as an optical slit, to those waves that propagate in the vector plane of the polarizing element. This action reduces the amount of transmitted light to approximately 30% of the emitted value. A common microscopy technique, especially in geological petrography, involves the use of crossed polarizers where two individual polarizing elements are inserted into the light path with their vector propagation planes crossed at a 90º angle with respect to one another. When a sample is placed in the light path between crossed polarizers, the only light emitted will be that which is refracted by the sample so that it can pass unimpeded through the second polarizer. In classical nomenclature, the first polarizer has been termed the polarizer while the second polarizer is termed the analyzer.
Samples that are visible between crossed polarizers are said to have optical birefringence. This means that these samples have a refractive index that depends on the direction of the electric field vector in the light. Many different kinds of samples are birefringent including liquid crystalline systems, single crystals, polycrystalline polymers, and minerals found in petrographic thin sections of rocks, among others. Light waves passing through a birefringent material are usually split into two perpendicularly plane-polarized waves polarized in the principal directions. The material has two different refractive indices, n1 and n2, for the two plane-polarized waves. As they pass through the material there is a relative retardation and phase shift and the polarized light passing through a birefringent sample will usually have its polarization state changed.
|
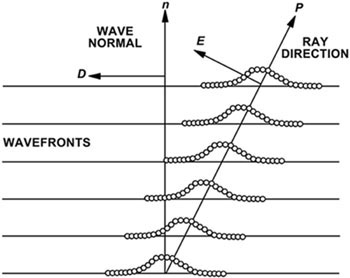
Parallel light beams and a single ray in a birefringent sample. The dotted curve is an indication of where the intensity of the light is at a maximum. The electric-field vector E is perpendicular to the beam direction P. |
A complicating factor is that in birefringent materials, the electric displacement vector D is usually not parallel to the electric field vector E as is depicted in Figure 2. The vector E is perpendicular to the light wave but the vector D is tangentical to the wavefront illustrated in Figure 2. Therefore, one must exercise caution in describing the "direction of light" in discussions of birefringence. Often, birefringent samples display a bright spectrum of colors when observed through a polarizing microscope. These beautiful colors are not the ones we generally equate with those observed in ordinary daylight, but rather they are interference colors formed in a definite sequence according to the path difference of the light beam through the birefringent material. A similar spectrum of colors are seen on soap bubbles or on a thin film of oil on water. The interference colors are in a character sequence called Newton's series (Delly, 1988). In the case of birefringent materials, the colors are formed in orders that must be interpreted according to material thickness and birefringence (n2- n1).
There are two classes of birefringent materials, termed uniaxial and biaxial, which have one and two optical axes, respectively. A birefringent material appears to be optically isotropic when plane-polarized light passes through it along an optical axis. If the refractive index of a uniaxial material exists at a maximum when the plane of polarization contains the optical axis it is said to possess positive birefringence. However, if the refractive index is at a minimum under these conditions, then the material has negative birefringence. The application of birefringence principles to the examination of petrographic thin sections has been described by many authors and the reader is referred to the many excellent textbooks on this subject and a short review published by Garlick (1990).
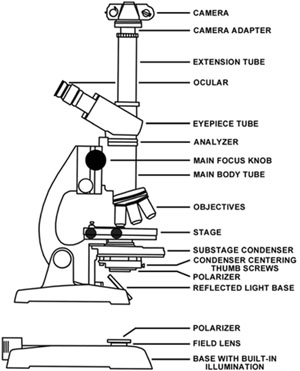
Any brightfield microscope can easily be converted for use with polarizing elements. Two polarizers will be needed to convert the microscope for use with polarized light. The polarizer responsible for polarizing the light emitted from the microscope light source is placed either directly on the field lens or can be taped (with electrical tape) to the substage condenser (refer to Figure 3 for a detailed microscope description). On microscopes with an internally directed lamp, it is sufficient to place a polarizer onto the field lens as is illustrated in Figure 3. This polarizer should be large enough to cover the lens completely. Low cost polarizers designed for camera lenses are sufficient for this purpose. But, if an external light source is reflected into the substage condenser through a mirror, it becomes necessary to tape a polarizer onto the bottom of the condenser (Figure 3). Many science supply houses and distributors offer an excellent selection of polarizing materials at somewhat low cost. When purchasing polarizing elements, remember to select materials that are as close to a neutral grey as possible. Avoid materials that are amber or green in color. These off-color materials will cause color shifts that must be corrected for in color photomicrography.
|
Schematic diagram of a light microscope outfitted for photomicrography. |
The second polarizer (which is termed the analyzer, as described above) is inserted inside the body of the microscope between the main body tube and the eyepiece tube. There is usually a lens mount covering the top main body tube and the analyzer can be taped or simply rested directly on this mount. Because of the restricted space within the main body tube, the analyzer is limited in physical size to 1-3 cm in diameter. An analyzer of this size can be obtained by cutting a small section from a sheet of polarizing material or by purchasing a small polarizer from a dealer. The analyzer and upper main body lens should be thoroughly cleaned to eliminate dust and fingerprints before reassembly of the microscope. After both polarizers are in place, activate the microscope light source, place a specimen on the stage, and view directly into the oculars (eyepieces).
Next, bring the image into focus and rotate the polarizer on the microscope base until the viewfield becomes very dark (maximum extinction). At this point, the polarization direction is perpendicular between the polarizer and analyzer and you then have crossed polarizers as described above. Some microscope manufacturers offer a low budget polarization kit ($150.00 to $300.00) that is easily user-installed. It is advisable to contact your microscope's distributor or manufacturer concerning the availability of these items if your budget is healthy. An excellent review on the assessment of microscopes for petrographic uses has been provided by Mathison (1990). O'Brien (1978) has developed a very inexpensive microscope setup designed for introductory geology students, and Hasson (1975) has described the installation of polarizers on a Kodak Carousel slide projector to project low magnification polarized images of geological thin sections.
Quantification of optical birefringence can be performed by adding compensators, also known as tint, retardation, and ë plates, between the sample and the analyzer. These plates are fabricated from slabs of birefringent material (such as quartz, mica, and gypsum) that are cut in specially oriented crystallographic directions. In this manner, the direction of the fast and slow vibration components are known with respect to the axis of the crossed polarizers. These plates are usually inserted into a slot in the microscope near the analyzer so that the slow axis of the plate is situated at a 45 angle to the polarizer. The plates will retard the light by either a fixed or variable, but known, amount. The colors seen in the microscope when a compensator is inserted into the light path will be changed depending on whether the sample is in an additive or subtractive position with respect to the compensator. The compensators are sometimes useful to aid in photomicrography of very weakly birefringence samples, due to a change in background color from black to gray or magenta to red, depending on the wavelength retardation of the compensator plate.
Among the useful methods of enhancing sample contrast are the interference methods in which contrast augmentation is similar to that observed in phase contrast microscopy with the elimination of edge "halo" effects. Differential interference contrast microscopy requires expensive objectives equipped with a special set of prisms termed Wollaston prisms that are optically matched to each objective (Howard, 1990). A relatively low-cost substitute for the interference contrast effect generated by the Wollaston prisms involves adapting a polarized light microscope with Savart plates (Delly, 1988) serving in place of the polarizers. Savart plates are flat plates of a suitable quartz crystal cut and polished to produce the necessary divided interference beams of light in order to generate the three-dimensional effect of interference contrast. Savart plates are commonly available from optical supply houses.
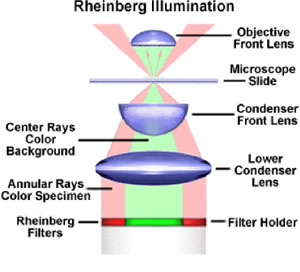
Another method of contrast enhancement was developed by microscopist Julius Rheinberg in 1896 (Strange, 1983). Rheinberg illumination is often referred to as optical staining, and lends an exciting spectrum of color and highlights to conventional microscopy techniques. It is especially useful for amorphous and unstained samples which lack sufficient detail for successful photomicrography. Rheinberg illumination is similar to conventional darkfield illumination except that the central opaque light stop at the base of the substage condenser (Figure 3) is substituted for a colored central stop as is illustrated in Figure 4. A sample viewed with the colored central stop will appear white on a background the color of the stop. Addition of a colored transparent annular filter will add color to the sample (Figure 4). A variety of materials can be employed for constructing the colored stops and annular rings. Colored cellulose acetate or gelatin filters are probably the most convenient, and many graphics supply houses sell, or sometimes give away, small sample books of these materials. By experimenting with a variety of different colored stops and annular filters, a wide spectrum of different images can be obtained.
|
Filter configuration for Rheinberg illumination. The central and annular filters can be coupled together with transparent tape and placed at the bottom of the substage condenser. |
The renovations described above apply only to transmitted light microscopy where polarized visible light passes directly through the sample. In reflected light microscopy, the light beam is reflected from the surface of the sample and scattered into the microscope objective. It is not a straightforward process to convert a biological transmitted light microscope for use with either polarized or interference contrast reflected illumination methods. To avoid investing in expensive reflected light attachments, oblique illumination from an external light source can be substituted to produce the reflected light effect. A high-intensity light source such as a fiber optics lamp (available for under $200.00) provides an excellent substitute. To achieve a semi-polarized light effect, the analyzer can be left in place and polarizers attached (by tape) to the external light source. Before final attachment, the polarizers should be rotated as described above to produce maximum extinction. Unpolarized room light, that will unavoidably be reflected into the objective, will slightly diminish the total amount of light extinction. This method of microscopy is particular well suited for examination of integrated circuits and other specimens that possess intricate surface detail.
Common biological stereo-binocular (dissecting) microscopes are also useful for reflected light examination of materials science and geological rock and mineral samples. These microscopes are particularly useful for photomicrography of small rocks and crystals. Stereo microscopes are often useful in the brightfield mode, but can also be operated with polarized light to obtain details of the surface structure of birefringent materials. To adapt a stereo microscope for polarized light, tape a large polarizer (such as a model designed to mount onto a camera lens) onto the lower portion of the main body tube. Insure that the polarizer completely covers the lens mounted in this lower portion of the tube. Next, adapt a polarizer to the external light source. If a fiber optics illumination device is used, simply tape the polarizer over the end of the fiber outlet tube. Fiber optics sources can be obtained that have a beamsplitter to divide the output light into two tubes. These sources are ideal for illumination of samples with reflected light because a sample can be illuminated from several directions to eliminate a shadow effect. In this case, be sure to cover both fiber outlet tubes with a polarizer. Place a mirror on the stage to reflect light directly into the objective and rotate the polarizers on the fiber outlet tubes until maximum extinction is reached. It is usually easier to block the light from one tube and adjust the other for maximum extinction, repeating the process again for the blocked tube.
Attaching a camera to the microscope is the last step. Microscope viewing heads come in three varieties: monocular (one eyepiece), binocular (two eyepieces), and trinocular (two eyepieces and a photography tube). A camera can be adapted to each of these viewing heads. Commercially available aftermarket camera adapters usually are attached to one of the viewing tubes with a thumbscrew and adjusted to be parfocal with the eyepieces by sliding the adapter up or down on the viewing tube. A simple camera back will be sufficient for photomicrography because the camera is required only to store, expose, and advance the film. The microscope itself acts as a camera lens. After a camera back has been adapted to a microscope, one should not rely on exposure values computed by in-camera exposure monitors. It is best to bracket exposures to get a handle on exposure times as is discussed in the section on photomicrography.
For optimal photomicrography, it is very important to insure that your microscope is aligned to produce an even illumination across the viewfield. Information on microscope alignment is available in owners manuals or in textbooks dealing with microscopy and photomicrography (See Delly, 1988 for a particularly good discussion on this subject).
PHOTOMICROGRAPHY
Recording images seen in the microscope onto photographic film allows scientists to produce a "hard copy" for research records. In an educational environment, classical photography assignments can be coupled with science microscopy studies to provide a multidisciplinary program in photomicrography.
Photomicrography encompasses the techniques of both black and white and color photography. Black and white film processing is substantially lower in cost that color film, if processing is done in-house. Unfortunately, many commercial film processors no longer offer black and white processing services or charge exorbitant amounts for this service. If budget restrictions force the exclusive use of black and white photomicrography, it is advisable to invest in darkroom equipment so students and research assistants can develop and print their own photomicrographs.
A green gelatin or interference filter should be inserted into the microscope lightpath between the light source and the first polarizer (see Figure 3) for black and white photomicrography. With built-in illumination, the filter can be placed on the field lens prior to the placing of the polarizer. On microscopes that use an external light source, the filter can be taped below the polarizer on the substage condenser.
We recommend the use of Kodak Technical pan film (or it's equivalent) with HC-110 developer for crisp images with excellent contrast and resolution. This film provides intricate detail imaging and reduces the continuous tonal tendencies of the popular black and white films. Printing can be done on Kodak Polycontrast (or again, it's equivalent) paper with Dektol developer. After processing a roll of film, carefully cut the negatives into sections of 5 frames each and store in specially made polyethylene storage sheets. Contact prints can be made by placing a sheet of negatives directly onto an 8" x 10" piece of Polycontrast paper and exposing for a few seconds with the enlarger lens aperture opened to the widest f-stop. Contact sheets are an ideal way of cataloging data and they provide a compact method for storing or sorting through many images. When an enlargement is needed, simply remove the appropriate negative strip from the protective sheet and print with an enlarger.
|
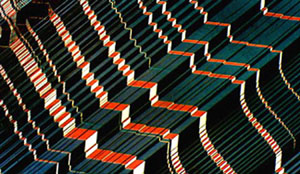
Transmitted light photomicrograph of a 0.02 inch-thick wafer cut from a single crystal of lanthanum aluminate (LaAlO3). Stairstep twinning, very evident in this photomicrograph, interferes with confluent thin-film formation of epitaxially deposited high temperature superconducting ceramics. |
In some instances black and white transparencies are needed for projection during lectures and at seminars. When these are desired, it will be necessary to use a direct-positive reversal processing kit to prepare the transparencies. Commercial reversal kits are available, although a much simpler method was described by Wisman and his colleagues several years ago (Wisman, et al, 1976).
Color photomicrography is considerably more complicated than black and white photomicrography because color film emulsions are color balanced for a particular spectrum of light (Davidson and Rill, 1989). The term color temperature refers to the wavelength spectrum emitted by a particular light source. For instance, films intended to be used outside in ordinary daylight or under fluorescent lighting are balanced during manufacture for a color temperature of 5500ºK while films made for indoor tungsten lightbulb use are balanced for a color temperature of 3200ºK.
The majority of microscopes use a tungsten-halide bulb as a light source. These types of bulbs emit a wavelength spectrum centered in the 3200ºK color temperature region. Therefore, films color balanced for this type of illumination will produce the best results. Using daylight balanced films under tungsten illumination will shift all color tones towards a decidedly yellow cast. Likewise, using tungsten balanced films under daylight illumination will shift color tones towards a bluer cast. All major film manufacturers have one or several 3200ºK films available in 35mm transparency format. Transparency film is preferable to color negative film for several reasons. Most importantly, all color negative films are color balanced for 5500ºK and must be manipulated during printing to avoid the yellow cast mentioned above. Most photo processors can not or will not produce satisfactory results with photomicrographs on color negative film. Also, the contrast and color saturation in transparency film cannot be equaled by color negative film. Finally, color transparencies are easier to label, store, and catalog and they can be projected at seminars.
With a 20 to 100 watt tungsten-halide bulb in your microscope, exposure times are usually very short and allow the use of slow films such as Ektachrome 50 or Fujichrome 64T. Using slow films reduces the grain size in photomicrographs and leads to higher quality enlargements. If tungsten balanced films are not available, a Kodak 80A or equivalent filter can be inserted into the lightpath between the light source and the first polarizer to allow the use of daylight balanced films with minimal color shift. If this filter is used, exposure times must be increased 1-3 f-stops to allow for a reduction in light intensity. Recently, Polaroid introduced a slow speed (ISO 40) color transparency film, designated Polachrome HC, with high contrast that is ideal for photomicrography. This film produces superb contrast and color saturation and can be user-processed in only 2 minutes with a low cost Polaroid processor.
When photographing new samples or after making changes to the microscope (such as installation of polarizers), the new exposure characteristics should be determined on a test roll of film. Bracket several exposures of the same viewfield at least one and preferably two f-steps over and under previous exposure times. This will assure at least one or several good exposures and will yield exposure time information useful for photomicrography of future samples.
The best film, in our opinion, is Fujichrome 64T, a highly color-saturated E-6 transparency film with excellent contrast. Recently, a new emulsion of this film was introduced that is designed to allow push processing with very little reduction in image quality. Push processing is a method developed to increase contrast (inherently low in photomicrographs) and color saturation. This is done by underexposing the film 1 to 2 f-steps and increasing the process time in the first developer during the E-6 process.
|
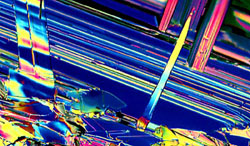
Reflected differential interference contrast photomicrograph of the ab plane surface of the high temperature superconducting ceramic, Bi2Sr2CaCu2Ox. This material is formed in thin platelets that can be easily cleaved with a piece of tape. |
The complicated E-6 process can be done in-house if the proper equipment is available. There are 7 steps to this process and the temperature must be carefully controlled to a constant 38.3º C ± 0.1º C. This is difficult to do without having a constant-temperature water bath dedicated to the task. A cheaper and easier alternative to the E-6 process is marketed by Kodak in the form of a "hobby pack" that contains the essential E-6 chemicals combined and packaged into 4 individual solutions. The hobby pack is much easier to use and has a far wider temperature latitude, although by following the temperature restrictions of the E-6 process, optimal results are obtained. We have found that identical, and in some cases superior results can be produced in the laboratory with this simplified process if a few rules are followed.
The first developer is the most critical part of the process and it is absolutely essential that the temperature be held to within the specified limits. Contrast can be increased by addition of 3.0 grams of phenidone (commercially available at photography chemical distributors) per liter of first developer. The additional contrast obtained from addition of the phenidone dramatically helps the images to reproduce what is seen in the microscope oculars. In many instances, the processed film has either an overall yellowish-green or magenta cast after drying. This can be eliminated by adjusting the pH of the color developer. The optimum pH given by Kodak is 11.1, but by increasing the pH by 0.2-0.7 units any extra magenta can be subtracted or by reducing the pH by the same amount, the yellowish-green cast can be eliminated. These hobby kits can be used to develop 10 rolls of film with 24 exposures in the magazines. As the solutions age, extended processing times are necessary to achieve the desired effects. Details on the time increases are given in an instruction booklet supplied with the kit. It is probably better to add 1-2 minutes to the color developer time given and add about 5 minutes to the bleach/fixer time to insure adequate bleaching of unwanted dyes.
By extending the time in the first developer by approximately 30%, you can push the process 1 f-step. This is very tricky and it is advisable to experiment with non-valuable film during the initial setup for push processing. Too much time in the first developer will definitely lead to an increase in grain size and the transparencies will lose a significant portion of their overall density. Films that are push processed should be underexposed by one or several f-steps. It is a good idea to bracket a set of photographs in the same viewfield to determine the precise number of f-steps to underexpose the film. Push processing will increase contrast and also color saturation at the cost of a small sacrifice in D-max, the overall film density. Too much underexposure will leave the processed transparencies very dark and dense. By carefully monitoring a bracket composed of exposures at every half or third of an f-step, the optimum underexposure can be determined.
For publication, it is sometimes necessary to obtain color prints made from photomicrograph transparencies. This can be done through commercial processors at a reasonable cost, however the quality is generally poor. Ilford produces a direct positive paper, called Cibachrome, which can be processed at room temperature in an inexpensive roller drum. Although it is rather expensive, Cibachrome produces prints that have superb contrast and color saturation. The process has only three steps: a developer, a bleach, and a fixer, and can be completed in 15 minutes. The roller drums can handle 8 x 10, 11 x 14, and 16 x 20 inch prints. We usually purchase only the 11 x 14 inch paper and cut each piece into 4 smaller 51/2 x 7 sections. Four of the smaller prints can be exposed and loaded into an 11 x 14 inch roller drum and processed simultaneously. These smaller prints are ideal for publication purposes.
It is important for any photomicrographer to develop good photographic skills. The high cost of commercial photography can be avoided if all film magazine loading and processing is done in the laboratory. By paying attention to all of the details, good photomicrographs can become a matter of routine.
PHOTOMICROGRAPHY IN GEOLOGY
In an effort to demonstrate the application of photomicrography to solve problems in the geological sciences, we will now describe three applications that utilize microscopy. The first application deals with the subject of high temperature superconductivity from a mineralogical point of view. The second involves investigations on the structure of the most common meteorites and the origins of the solar system, while the third example derives from samples recovered from the Lunar surface by Apollo astronauts.
|
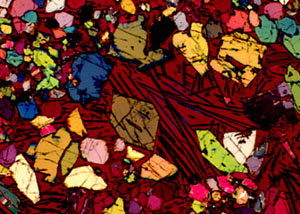
Transmitted light photomicrograph of a thin section of quenched synthetic chondrule displaying crystals typical of porphyritic textures. The final product contains glass or a fine grained material enclosing the equilibrium phenocrysts. |
Perovskites
Perovskites are a large family of crystalline ceramics that derive their name from a specific mineral known as perovskite (Hazen, 1988). They are the most abundant minerals on earth and have been of continuing interest to geologists for the clues they hold to the planet's history. The parent material, perovskite, was first described in the 1830's by the geologist Gustav Rose, who named it after the famous Russian mineralogist Count Lev Aleksevich von Perovski. The general formula for perovskites is ABX3, which consists of a cubic lattice made from three distinct chemical elements present in the ratios 1:1:3. The A and B atoms are metallic cations and the X atoms are non-metallic anions (usually oxygen). The A cation is usually the larger of the metal ions and lies in the center of the cubic lattice, with the smaller B cation occupying each of the 8 corners of the lattice. The non-metallic X anions populate the midpoints of the cube's 12 edges. The number of materials having this elemental ratio is numerous and many of the minerals do not fit ideally into the pattern displayed the mineral perovskite, which is also known as calcium titanate CaTiO3. In this mineral the larger calcium ion occupies the center of the cubic lattice, while the smaller titanium ions occupy the corners of the lattice with the oxygen anions manning the edge centers.
Many different ions can fill the center of the perovskite cubic lattice to produce the hundreds of ideal and modified perovskites now known. Barium, potassium and the rare-earth elements, cerium through lutetium (atomic numbers 58 through 71), make up the two dozen or so ions that fall into the A category. An amazing 50 different elements, almost half of the periodic table, are known to adopt B sites in these ubitiquous ceramics. While oxygen is the most common anion to take the X positions, other non-metallic elements such as the halogens can also form perovskites.
The properties of perovskites are as diverse as their chemical formulas. The ideal perovskites are electrical insulators with all of the atomic sites filled with strong ionic bonding that represents a high resistance to electron flow. These strong bonds make perovskites rock-like, and difficult to deform and melt. By substituting different sized ions into the lattice positions, a wide spectrum of properties can be obtained from this class of ceramic minerals. Barium titanate (BiTiO3) is perhaps the best known ferroelectric ceramic currently in commercial use. This material is often incorporated in capacitors to momentarily store electrical charges for later use in electrical circuits. The barium ion is much larger than calcium and this causes a distortion of the cubic lattice that allows the off-centered cations to store and release electrical energy quite efficiently. As stronger electrical fields are applied to this material, more cations are energized and displaced and the more strongly polarized the crystal becomes. The off-center cations also contribute to a property known as piezoelectricity. When the titanium atoms are shifted by an external electrical field, the whole crystal changes shape. This mechanical deformation of the barium titanate crystal generates an electrical field and allows the construction of electrical transducers that convert mechanical energy into electrical energy or visa versa.
Barium lead oxide (BaPbO3) is a black metal-like conductor that provides an excellent example of the changes that can result from substitutions in the A and B positions. By replacing the lead with increasing amounts of bismuth, a continuous series of compositional variants can be produced from barium lead oxide to barium bismuth oxide. As the composition approaches BaPb0.8Bi0.2O3, the ceramic mineral becomes a semiconductor. Unlike either of the parent compounds, some of these intermediate mixtures become superconducting when they are cooled almost to absolute zero.
A commercially important class of perovskites is known collectively as PZT. This term encompasses lead titanate (PbTiO3) and the continuous series generated when zirconium is substituted for titanium until the parent lead zirconate (PbZrO3) is formed. All known PZT ceramics so far developed exhibit a remarkably strong piezoelectric effect and are found in a wide assortment of devices including loudspeaker buzzers, electrical relays, pressure gauges and scanning tunneling microscope heads. The varying compositions of PZT ceramics allows the crystals to vibrate at distinct frequencies in response to an electrical field. Several television designers have utilized this effect to design PZT perovskites as filters to reduce unwanted noise and mask undesirable frequencies.
Another compositional variation in perovskites probably controls the structure and properties of the earth's interior. Magnesium-iron silicate (Mg,Fe)SiO3, which has been intensively studied by a number of geophysicists (Glazer, 1972; Hazen, 1988; Yagi et al, 1978), assumes the perovskite structure at the high pressure of several hundred atmospheres. Studies conducted on the earth's upper-mantle silicate materials such as garnets, olivines, spinels, and pyroxenes suggest that at the high pressures that dominate the deep interior, these silicates become transformed and combine with other minerals to form rocks that are primarily composed of perovskites.
Currently, the most intensely studied perovskites are those that superconduct at liquid nitrogen temperatures. Superconducting perovskites were first discovered by IBM researchers Bednorz and Müller (1986) who were examining the electrical properties of a family of materials in the Ba-La-Cu-O system. They found a material of uncertain composition, BaxLa5xCu5O5(3-y) that lost all resistance to electrical current flow and displayed the Meissner effect, that of excluding all magnetic fields, at the astonishingly high temperature of 35ºK. A flurry of activity followed in the field and several months later a yttrium containing perovskite (YBa2Cu3O7-x) was reported that could superconduct at temperatures slightly higher than 90ºK (Wu et al, 1987). This material has received a considerable amount of attention in the literature (reviewed by Engler, 1987, and Hazen, 1988).
Studies of thin films of the yttrium superconductor indicate that it is capable of handling fairly high currents in films only a few microns thick. Figure 5 is a polarized transmitted light micrograph of a <100> oriented polished wafer cut from a synthetic single crystal of the related perovskite, lanthanum aluminate (LaAlO3). This material is a fairly good lattice match for the thin film deposition of the yttrium superconductor by epitaxial methods such as Molecular Beam Epitaxy (MBE), Metal-Organic Chemical Vapor Deposition (MOCVD), and laser ablation. The primary or growth polysynthetic twins decorated by a staircase optical polarization effect, quite evident in this photomicrograph, is probably due to orientation reversals across twin planes by the smaller domains that make up the elongate twin individuals. This staircase effect interferes with confluent thin film formation and research is currently underway to find an economical related material that is devoid of these defects.
The highest Tc superconducting ceramic discovered to date is Bi2Sr2CaCu2Ox, which superconducts at 125ºK (Khurana, 1988). Figure 6 illustrates a reflected light photomicrograph of the ab plane surface of a single crystal platelet of this superconducting ceramic. The crystals are easily cleaved with a section of Scotch tape to obtain samples for chemical and physical studies.
Between 1986 and 1988 the critical temperature for superconductivity in perovskite ceramics was raised by more than 100ºK, but in the past three years only several degrees have been added to this remarkable elevation. Research is fast and furious in this field, and while investigators are still synthesizing new ceramic perovskites, they are also directing their attention to practical applications for the superconducting ceramics that already exist.
Synthetic Chondrules
Meteorites hit the earth with an estimated rate of three to four a day (Marvin, 1986), although the planet is very large and is covered by so much water that very few of these falls are ever witnessed and recorded. Throughout the chronicled history of our planet, meteorite falls and impacts have been observed. Geologists and Astrogeophysicists study meteorite composition and properties to learn more about the origin and evolution of the solar system. Meteorites derive from a variety of sources including the asteroids and the moon, as well as some that were formed during the birth of the solar system. For the purposes of classification, meteorites can be roughly divided into four categories. Over 90% of recovered meteorites are classified as stones (Wood, 1968). These stones consist of two classes. The Chrondites are the most common stones comprising approximately 85% of all meteorites recovered. Achrondrites are the other principal stone meteorite constituting about 7% of the total number of meteorites recovered. The other principal meteorites are the more rare stony-irons (approximately 1.5%) and the irons (approximately 6%). This discussion will be limited, however, to the stony Chondrite meteorite class.
Gustav Rose, the renowned geologist who coined the mineralogical term perovskite, cataloged the meteorite collection of the University of Berlin in 1864 and named the largest class of stony meteorites Chondrites based on the Greek word chondros, meaning "grain of seed", as a reference to the tiny rounded bodies that characterize these stones (Wood, 1968). The small spherical inclusions have now been commonly referred to as Chondrules.
Chondrules are small spheres (.1 to 10mm in diameter) which are the major constituent of chondritic meteorites. Chondrites are considered samples of primitive solar system materials. If we can understand how chondrules form, we will have an important clue to the early history of our solar system. Most chondrules have an igneous texture which forms by crystal growth (usually rapid) from a supercooled melt. Such textures are commonly described as porphyritic (large, equant crystals in a fine grained matrix), barred (dendrites comprised of parallel thin blades or plates), or radiating (sprays of fine fibers).
The models proposed for formation of chondrules can be divided into two groups (McSween, 1977). In one group of models, chondrules form by melting and subsequent crystallization of preexisting, largely crystalline material from the solar nebula. The primary differences between these models are the kinds of materials which are melted and the nature of the sources of heat for the melting. In the other group of models, chondrules form by condensation of liquids from the solar nebula gas which then crystallize upon cooling. Variations between these models result from differences in the condensation sequence of the minerals and melts and the temperatures of nucleation.
One means of testing models of chondrule formation is to determine the conditions necessary to duplicate these textures by experimentally crystallizing chondrule melts in the laboratory. Efforts to reproduce the textures of chondrules experimentally have been successful only when we began to understand the important role that heterogeneous nucleation plays in the development of igneous rock textures. Unless heterogeneous nuclei are present in the chondrule melt, porphyritic textures will not be produced. The dendritic or radiating textures will form instead.
|
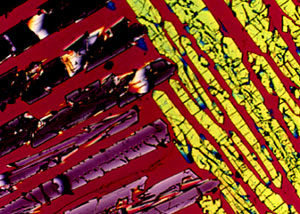
Transmitted light photomicrograph of a thin section of a synthetic chondrule displaying multiple plate dendrites. In these samples it is difficult to restrict nucleation to a single event and, subsequently, the multiple dendritic texture is commonly observed. |
The treatment of heterogeneous nucleation follows the model developed by Turnbull (1950) to explain many of the characteristics of heterogeneous nucleation. This model was applied to heterogeneous nucleation in basaltic systems by Lofgren (1983). Simply stated, the model says that in any steady-state melt at a given temperature there is a characteristic distribution of embryos. The embryo is crystalline material which is smaller than the critical size necessary to be a stable nucleus and cause nucleation. It is a subcritical-sized potential heterogeneous nucleus. Embryos exist whether stable, supercritically-sized nuclei are present or not. If a melt is sufficiently superheated, embryos can be eliminated. Nucleation would then require a surface, presumably the container and the barrier to nucleation would be much higher than in the case where embryos were present. Qualitatively, such nucleation would resemble homogeneous nucleation; but, if a surface is available, the energy barrier would be much lower than for homogeneous nucleation. Glasses would form from chondrule melts most readily if they are superheated, thus destroying the embryos and increasing the barrier to nucleation. Lower melting temperatures would allow embryos to be retained. These can then grow upon cooling and become nuclei. Embryos also can become nuclei without changing size, because the size at which an embryo becomes a nucleus depends upon the degree of supercooling in the melt. Thus, an increase in the degree of supercooling can cause an embryo to become a nucleus and nucleation to occur.
If relict crystals are present in the melt at the initiation of cooling, the more equilibrium-like crystals typical of porphyritic textures are formed. When such experiments are quenched, the final product contains glass or fine grained material, often dendritic, enclosing the equilibrium phenocrysts. An example of this texture produced in experiments is shown in Figure 7. Equant, well formed crystals of olivine are set in a glassy matrix with a few dendrites present. In the natural prophyritic chondrule the glass has usually crystallized to a very fine grained material. In general, the size of the phenocrysts decreases and their number increases as the temperature at which the crystalline starting material melted is lowered and thus the number of nuclei increases. The range of conditions that control the development of porphyritic texture has been studied as a function of variations in the number, distribution, and kinds of heterogeneous nuclei (Lofgren and Russell, 1986; Lofgren, 1989). The transition from porphyritic texture to radial or barred (dendritic) texture for melts of constant composition has been studied as a function of the presence or absence of heterogeneous nuclei and cooling rate. Such variations in texture within a single melt have already been demonstrated for melts of lunar and terrestrial basalt composition (Lofgren, 1980, 1983; Grove and Beatty, 1980).
The "classic" barred olivine texture is a single plate dendrite (Donaldson, 1976) which shares the entire chondrule with the remaining glass or subsequent crystallization products. Olivine rimming the chondrule is often in optical continuity with the dendrite and thus is part of the plate dendrite. Because this texture is so striking, barred olivine (BO) chondrules are well known even to people outside the field of meteorites. When chondrules are discussed, a photomicrograph of a barred olivine texture is usually chosen as one of a few or even the only example. It is not surprising that considerable effort has been expended understanding its origin. Barred olivine textures comprise only a few percent of melt-textured chondrules, usually less than 5% (Gooding and Keil, 1981). The "classic" barred texture represents only 10% of the type 3 ordinary chondrite BO chondrules. By careful study, Weisberg (1987) determined that the multiple plate dendrite is a much more common that the single dendrite. Most investigators propose that BO chondrules form from melt droplets that crystallize rapidly upon cooling.
Attempts to duplicate BO textures experimentally showed that it is difficult to produce the "classic" single dendrite chondrule; conversely, multiple plate dendrites are observed commonly in experimental charges (Lofgren and Lanier, 1990). It turns out to be very difficult to restrict nucleation to a single event. An example of a barred dendrite is shown in Figure 8. Each dendrite is a series of parallel plates connected in the third dimension with respect to the plane of the thin section. The dendrite forms when nuclei are eliminated from the melt and only embryos remain. If the melt is cooled rapidly and does not crystallize, it becomes supercooled and embryos eventually become stable nuclei. When an olivine nucleus begins to grow, it will become a dendrite if the supercooling is sufficiently high.
These experiments clearly demonstrate the crystalline material must be present in the solar nebula when the chondrules form and suggests that they did not form by direct condensation from vapors in the solar nebula. Individual crystals most likely formed first and these were remelted in clusters to form the chondrules. An interesting fact that has come out of these studies is that the rate at which the melt droplets cool is not critical. They can cool at nearly the same rate and produce either the porphyritic texture if nuclei are present when cooling is initiated, or form dendrites (barred) chondrules if only embryos are present. The important factor is how hot the droplets become before they begin to cool and thus whether they retain any crystalline precursor material to act as nuclei or whether nuclei have to form from embryos. If the melt droplets are heated hot enough that even the embryos are eliminated, the droplets usually do not crystallize when cooled and form glass chondrules. Glass chondrules are rare and this places an upper temperature limit to which the melt droplets are heated which is approximately 1650ºC. A minimum melting temperataure of 1550ºC is dictated by the minimum amount of melting required to produce the observed textures. It is still not clear, however, what heat source provides such conditions (Wood, 1988). A popular model is heating due to viscous drag on particles as they move through dense parts of the solar nebula as proposed by Wood (1984).
|
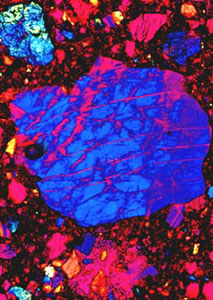
Transmitted polarized light photomicrograph of a lunar basaltic lava sample collected from the Oceanus Procellarum mare region by Apollo 12 astronauts. This sample is 3.15 billion years old and gave the first indications that Granite exists on the moon. |
Chemical analysis of chondrites (Wasson, 1974) indicates that there is a variety in their composition leading us to believe that they are not all derived from a common source. Most chondrites are composed primarily of olivine, feldspar, orthopyroxene, with several metals including kamacite and taenite. Continuing studies on the chemical and physical nature of chondrites and their formation is providing insight into the history of the solar system.
Lunar Mineralogy
Between 1969 and 1972 the National Aeronautics and Space Administration (NASA) successfully landed 12 Apollo astronauts on the lunar surface. The astronauts who visited the Moon carefully collected 2, 196 documented samples of lunar soils and rocks weighing a total of 382 kilograms (843 pounds) during approximately 80 hours of exploration. It is important to note that these samples were gathered from a harsh lunar environment that included wildly fluctuating temperatures in an almost complete vacuum, potentially dangerous solar irradiation, and the uncertainty of return to Earth due to equipment failure.
Geologists hoped that exploration of the lunar surface would establish its composition, internal structure, geological history, and evolution. In this respect it was thought that the Moon would serve as a model for the early history of the Earth and the rest of the solar system. Yet, from the Apollo missions, it has been determined that the Moon is far more complex than previously thought. The Earth's only satellite, which was formed approximately 4.6 billion years ago along with the rest of the planets, has partially melted and differentiated during in its history. The first melting occurred very shortly after initial formation of the Moon and apparently resulted in a widespread molten ocean that cooled to form a thick crust. While the satellite was cooling to form a solid body, several sections of the interior remelted, presumably due to radioactive isotopic decay, to form lava flows on the side facing the Earth.
The lunar surface can be roughly divided into two domains. About 20% of the Moon's surface is covered by dark lunar mares (latin for seas) or lowland regions. At a low sun angle, the lunar mares display wrinkle ridges and flow fronts indicating that they are filled with frozen liquid. Before the Apollo missions, it was thought that the mares were relatively young because they are so sparsely cratered (Meyer, 1987). The Apollo astronauts recovered a large collection of samples from the mares which, to the surprise of many geologists, gave evidence that the maria are extremely old with ages ranging from 3.1 to 3.8 billion years. The mares are filled with basaltic lava similar to the lavas found here on Earth. Mare basalts are volcanic lavas rich in iron and titanium oxide minerals that formed when molten rock from the interior of the Moon surfaced and cooled. For chemical purposes, the mare basalts can be divided into two groups (Meyer, 1987).
|
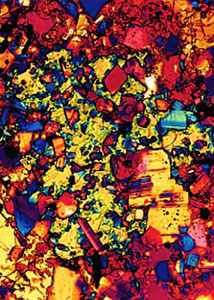
Transmitted polarized light photomicrograph of a lunar impact breccia sample collected from the Descartes highland plains region by Apollo 16 astronauts. This sample is 3.8 to 4.2 billion years old and gave evidence that the lunar highland plains were formed by meteorite impacts. |
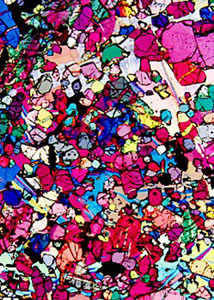
An older high titanium group with ages ranging from 3.5 to 3.8 billion years was collected from the Mare Tranquillitatis and Taurus-Littrow mare regions by Apollo 11 and 17 astronauts. A younger low titanium group of basalts with ages ranging from 3.1 to 3.4 billion years was recovered from the Oceanus Procellarum and Mare Embrium regions by the Apollo 12 and 15 astronauts. These age differences and the wide variety of different mare chemistries, where the titanium oxide composition varies from 1 to 13 percent, indicates that the mare basalts could not have been generated from one common source region or common parental magma through different degrees of partial melting. Figure 9 is a low magnification, polarized transmitted light photomicrograph of a polished thin section cut from a sample collected from the Oceanus Procellarum mare region by Apollo 12 astronauts. Studies conducted on this sample (Dungan and Brown, 1977) indicate that this is a low titanium, medium-grained, olivine basalt that possesses an exceptionally high magnesium content. Large pyroxene oikocrysts surround numerous rounded olivine crystallites, and patches of glomerophric olivine are present in some areas. The sample is composed primarily of the minerals olivine, plagioclase and pyroxene with a trace amount of iron and titanium oxides. Chemically, the rock is about 42% silicon dioxide, 22% ferrous oxide, with the rest being mainly magnesium, calcium, and aluminum oxides.
Surrounding the mares are the lighter-colored hilly and mountainous highlands. The rugged highlands are covered with countless small craters formed when meteorites struck the surface early in the history of the Moon. The lunar mares also possess craters, although not as many because the rate at which meteorites hit the Moon has decreased with time. Most of the rocks found in the highlands are breccias, composed of lithified aggregates of clastic debris and melt produced by meteorite bombardment of the lunar surface. Most of the breccias were recovered by the Apollo 14 and 16 missions at the Fra Mauro and Descartes plains regions in the lunar highlands. These samples proved to be very old with ages ranging from 3.9 to 4.0 billion years. Lunar breccias have a wide variety of matrix textures ranging from fragmental to vitric to crystalline. Figure 10 is a low magnification polarized transmitted light photomicrograph of an impact-melt breccia that was collected from the lunar highlands during the Apollo 16 mission. As can be seen in the micrograph, it is a very dense and coherent sample with a distinctive poikilitic texture. This sample has been studied in detail by Albee and coworkers (Albee et al, 1973), and has been radioactivity dated at about 3.93 billions years.
The lunar surface is covered by a layer of (disorganized) debris which has been termed the lunar regolith (Meyer, 1987). The thickness of this regolith varies from about 5 meters in the mare regions to approximately 10 meters in the lunar highlands. A majority of the regolith is composed of a fine gray soil with a density of about 1.5 g/cm3, however the regolith also contains breccias and fragments from the local bedrock. Figure 11 is a transmitted polarized light photomicrograph of a lunar regolith breccia recovered part way up the slope of the Apennine front by Apollo 15 astronauts. The sample, studied in detail by Simon and his colleagues (Simon et al, 1986) and has been found to contain a wide variety of glass, mineral, and lithic fragments encapsulated into a brown glass matrix.
|
Transmitted polarized light photomicrograph of a regolith breccia consisting of a wide variety of glass, mineral, and lithic fragments in a brown glass matrix. It was recovered on the slope of the Apennine Front at the Apollo 15 landing site. |
Most of the minerals found in the Moon rocks had already been examined and characterized during routine geological investigations of rocks found here on the Earth. The exception was three minerals that could only have been produced under the extreme conditions found on the Moon. A new mineral rich in titanium and iron oxides was named armalcolite after Neil Armstrong, Edwin Aldrin, and Michael Collins, crew members of Apollo 11, the first mission to successfully land on the Moon. Rocks found in the lunar highlands are generally rich in the common white mineral feldspar that is composed of calcium and aluminum silicates. A highly unusual class of rocks found in the highlands was given the nickname KREEP after its unique enrichment in potassium (K), rare-earth elements (REE), and phosphorus (P).
The age of the lunar samples was determined by the abundance ratio of radioactive isotopes (Meyer, 1987). It has been found that the age of most highland rocks has been reset by shock and heat produced by huge meteorite impacts. From radioactivity dating, researchers can determine when these impacts occurred. Most of the samples have ages centering around 4.0 billion years, although some rocks have escaped meteoritic bombardment and are as old as the Moon itself (4.6 billion years).
The lunar samples were stored in sealed "rock boxes" during the return to Earth, although some samples were exposed to the atmosphere of the Lunar Landing Module and the Command Module. After arriving at the Johnson Space Center in Houston, all lunar samples were quarantined for 6 weeks in the Lunar Receiving Laboratory to insure the absence of extraterrestrial life forms. During the quarantine period, the samples were cataloged, photographed, and given a preliminary examination. After more careful examination, it became evident that life forms, organic molecules, and water was absent from the lunar samples and the quarantine was discontinued for the later Apollo missions.
Lunar samples are stored and prepared for allocation to research scientists in the Lunar Curatorial Facility at the Johnson Space Center. This facility provides a high-efficiency air filtration system that serves to remove dust and other particles from the laboratory air to a degree of less than 1000 particles per cubic foot. A slightly positive air pressure is maintained within the building and the floor plan restricts access to the storage vaults so that areas with the most traffic are separated from areas where the samples are kept.
The samples are stored and examined exclusively in nitrogen-filled glove boxes. Only ultra-high purity nitrogen gas, produced by boiloff of liquid nitrogen, is used to store the rocks. This somewhat inert atmosphere prevents chemical changes in the samples that would be unavoidable in the open atmosphere. The most severe reaction would probably be oxidation of metallic iron grains in the samples. The lunar samples are only allowed to come into contact with three materials: aluminum, teflon, and stainless steel. Investigators handling the rocks use teflon overgloves and stainless steel tongs. These tools are periodically cleaned with acid and rinsed in freon to avoid any cross-contamination of the samples. Contamination by organic substances in continuously monitored with ultraviolet lamps. During storage, the samples are kept in sealed teflon bags that are placed in stainless steel containers with bolt-on tops. A positive seal is provided by an aluminum gasket between knife edges on the top and bottom of the container lid. The sample containers are permanently stored in nitrogen-filled cabinets in a bank-like vault with thick steel-reinforced concrete walls.
Lunar samples probably serve as their own best containers so they are not cut up unnecessarily in an effort to avoid contamination (Meyer, 1987). When a sample is needed for an investigation, it is transferred into a glove box and removed from its sealed container. A rigid protocol, designed to minimize contamination, is used for removing the various layers of teflon bags. The glove boxes are cleaned with liquid freon between samples to prevent cross-contamination from sample dust, and only one parent sample is allowed to occupy a glove box at any particular time. Also, separate glove boxes are used for each Apollo mission.
The procedure for processing lunar samples involves carefully weighing, photographing, and describing each individual sample. As the rocks are cut apart, each subsample is also weighed and photographed. The photographs all contain the image of an orientation cube that relates the orientation of the subsample to that of the parent and also to the original lunar surface orientation. This is essential so that orientation parameters are available for solar flare, cosmic ray and micrometeorite exposure studies. During the cutting process, the samples are dusted with nitrogen gas. Maps are made of the saw cuts and the resulting surfaces of the rocks using binocular microscopes. The large rocks are initially cut apart with a diamond-edged bandsaw inside the nitrogen filled glove box. Since it is impractical to cool the surface of the rock during this cutting procedure, some rocks probably grow quite hot during this process. A certain degree of contamination is probably introduced at this point because a metal smear can be observed on the sawn surfaces of some of the hardest rocks. The resulting slabs from large rocks and smaller samples are broken up with a stainless steel chisel. Immediately after completion of the subdividing operation, the subsamples are reassembled into their original positions and photographed as a group for the purposes of documentation. The photographs are used to construct three-dimensional maps that locate any particular subsample so that investigators will be aware of the position of their samples in relation to others that might appear in the scientific literature.
To prepare thin sections for microscopy, a sample is first impregnated with epoxy under vacuum. Next, the sample is cut with a diamond blade using alcohol as a coolant and then ground flat with silicon carbide followed by polishing with diamond. After polishing, the sample is affixed to a glass microscope slide with epoxy resin. The final preparation involves grinding the sample to an approximate thickness of 100 microns followed by hand polishing to a 30 micron thickness using diamond paste on bond paper. Absolute ethyl alcohol is used in all phases of this preparation to avoid unwanted hydration of the samples.
Examination of thin sections prepared from lunar samples is best done with transmitted polarized light (see Figures 9-11). Using this technique, investigators can get a handle on many of the properties displayed by these samples. Characteristics such as crystal shape and twinning, melt inclusions, cracks, fractures, and chemical zoning can be readily documented with polarized light microscopy. In addition, the birefringence of the samples can be recorded with quarter-wavelength and one wavelength retardation compensators. Many samples are quite colorful under polarized light and color photomicrography can yield beautifully colored micrographs (Figures 9-11). Reflected light microscopy also aids in the identification of minerals present in the samples and can be used to the anisotropy and reflectivity of the samples.
In spite of all that has been learned from examination of lunar samples, there is yet many unanswered questions about the Moon. For instance, the most fundamental question is still how the Moon was formed. Theories range from formation with the Earth as a double-planet system, fission from the Earth followed by establishment of a new orbit, to capture by the Earth as the Moon traveled through space. Another central question is the asymmetry of the Moon. The side facing the earth is filled with the dark mare regions while the opposite side is composed mostly of highlands. What influence did the presence of the Earth have on this phenomena? These and many other questions remain unanswered until more research can be conducted on the lunar samples and on the Moon itself. For a complete accounting, it may be necessary to venture back to the surface of our nearest neighbor.
CONCLUSIONS
Photomicrography is a very powerful tool for investigating samples in geology and geological petrography. Although the new microscopes available today are very "user friendly" with respect to photographic exposure parameters, the best results are obtained when the photomicrographer pays careful attention to the photographic aspect of microscopy.
ACKNOWLEDGEMENTS
The authors would like to thank Drs. John W. Dietrich and Charles Meyer from the NASA Johnson Space Center for loaning lunar and chondrule samples and very useful advice. Tom Fellers has been particularly helpful in discussions concerning microscopy and photography. Support has been generously provided by Dr. Jack Crow, director of the Center for Materials Research and Technology (MARTECH) and the National High Magnetic Field Laboratory (NHMFL) at FSU. Wallace W. Thorner has provided excellent graphics advice and support. Microscopes used in the study were provided by Steven Page and Lynda Ruf of the Nikon Instrument Group, Melville, New York.
ABOUT THE AUTHORS
Michael W. Davidson is a research scientist holding joint appointments at the Institute of Molecular Biophysics, the Center for Materials Research and Technology (MARTECH), the National High Magnetic Field Laboratory (NHMFL), and the Supercomputer Computations Research Institute (SCRI) at the Florida State University. His color photomicrography career started late in 1986 during morphological studies on liquid crystalline DNA. He has developed advanced techniques at FSU for processing color film and paper and has written numerous articles on the subject. At last count, his photomicrographs have appeared on the covers of over 100 scientific and trade periodicals.
Gary E. Lofgren is a scientist with the National Aeronautics and Space Administration and is located at the Johnson Space Center in Houston. He has been with NASA 23 years. He first came to NASA to help plan the exploration of the moon and to study the Lunar samples. He currently directs a laboratory at the Johnson Space Center in which high temperature and pressure history of lunar and meteorite samples are duplicated experimentally. These experiments help to understand the early history of our solar system.
REFERENCES CITED
Albee, A. L., Gancarz, A. J., and Chodos, A. A., 1973, Metamorphism of Apollo 16 and 17 metaclastic rocks: Proceedings of the 4th Lunar Science Conference, p. 569.
Bednorz, J. C. and Müller, K. A., 1986, Possible high Tc superconductivity in the Ba-La-Cu-O system: Zeitschrift für Physik B, v. 64, p. 189.
Brice, W. R., and Lind, B. H., 1987, A manual of photographs as a teaching tool in petrography: Journal of Geological Education, v. 35, p. 206.
Davidson, M.W. and Rill, R.L., 1989, Photomicrography: Common ground for science and art: Microscopy and Analysis, May (no volume number), p. 7.
Davidson, M.W., 1990a, Fabrication of unusual art forms with multiple exposure color photomicrography: the Microscope, v. 38, p. 357.
Davidson, M. W., 1990b, Publishing your photomicrographs: Microscope Technology and News, v. 2, p. 4.
Davidson, M.W., 1991a, Integrated circuits in and under the microscope: Microscope Technology and News, v. 3, p. 6.
Davidson, M.W., 1991b, Microscapes: Fascinating photography with a simple light microscope: Peterson's PHOTOgraphic, April (no volume number), p. 92.
Delly, J.G., 1988, Photography through the microscope: The Eastman Kodak Company, Rochester, New York, Publication P-2, 104 p.
Donaldson, C.H., 1976, An experimental investigation of olivine morphology: Contributions to Mineralogical Petrology, v. 57, p. 187.
Dungan, M.A. and Brown, R.W., 1977, The petrology of the Apollo 12 basalt suite: Proceedings of the 8th Lunar Science Conference, p. 1339.
Engler, E. M., 1987, Superconductivity at accessible temperatures: Chemtech, September (no volume number), p. 542
Feldman, L.C., 1986, Fundamentals of surface and thin film analysis: North Holland, second edition, 352 p.
Garlick, G.D., 1990, A graphic guide to the optical properties of minerals: Journal of Geological Education, v. 38, p. 426.
Glazer, A.M., 1972, The classification of tilted octahedra in perovskites: Acta Crystallographica, Section B, v. B28, p. 3384.
Gooding, J.L., and Keil K., 1981, Relative abundances of chondrule primary textural types in ordinary chondrites and their bearing on conditions of chondrule formation: Meteoritics, v. 16, p. 17.
Grove, T.L. and Beaty, D.W., 1980, Classification, experimental petrology, and possible volcanic histories of the Apollo 11 high-K basalts: Proceedings of the 11th Lunar Planetary Science Conference, p. 149.
Hasson, K.O., 1975, Conversion of a Kodak Carousel into an inexpensive polarizing thin-section projector: Journal of Geological Education, v. 23, p. 17.
Hasen, R.M., 1988, Perovskites: Scientific American, v. 258, p. 74.
Howard, T., 1990, The Nomarski method: Microscope Technology and News, v. 2, p. 4.
Inoue, S., 1986, Video microscopy: Plenum Press, first edition, 584 p.
Khurana, A., The Tc to beat is 125K: Physics Today, v. 41, p. 21.
Lofgren, G.E., 1980, Experimental studies on the dynamic crystallization of silicate melts: Physics of Magmatic Processes (ed. R. B. Hargraves), p. 487.
Lofgren, G.E., 1983, Effect of heterogeneous nucleation on basaltic textures: A dynamic crystallization study: Journal of Petrography, v. 24, p. 229.
Lofgren, G.E., 1989, Dynamic crystallization of chondrule melts of porphyritic olivine composition: Textures experimental and natural: Geochimica et Cosmochimica Acta, v. 53, p. 461.
Lofgren, G.E. and Russell, W.J., 1986, Dynamic crystallization study of chondrule textures in melts of porphyritic and radial pyroxene composition: Geochimica et Geophysica Acta, v. 50, p. 1715.
Lofgren, G.E. and Lanier, A.B., 1990, Dynamic crystallization study of barred olivine chondrules: Geochimica et Geophysica Acta, V. 54, p. 3537.
Marvin, U.B., 1986, Meteorites, the moon and the history of geology: Journal of Geological Education, v. 34, p. 140.
Mathison, C.I., 1990, Assessment of petrological microscopes: Journal of Geological Education, v. 38, p. 116.
McGehee, R.V., 1966, Adaption of ordinary microscopes for petrographic use: Journal of Geological Education, v. 14, p. 116.
McSween, H.Y., Jr., 1977, Chemical and petrographic constraints on the origin of chondrules and inclusions in carbonaceous chondrites: Geochimica et Cosmochimica Acta, v. 41, p. 1843.
Meyer, C., 1987, The lunar petrographic thin section set: NASA Curatorial Branch Publication Number 76, 61 p.
O'Brien, L., 1978, Student use of thin sections in introductory geology: Journal of Geological Education, v. 26, p. 75.
Pawley, J.B., 1989, Handbook of biological confocal microscopy: Plenum Press, first edition, 232 p.
Saeva, F.D., 1979, Liquid Crystals: The fourth state of matter: Marcel Dekker, second edition, 491 p.
Silverman, D.A., 1987, Microscapes: The hidden art of high technology: Functional Photography, v. 22, p. 24.
Simon, S.B., Papike, J.J., and Gosselin, D.C., 1986, Petrology of the Apollo 15 regolith breccias: Geochimica et Cosmochimica Acta, v. 50, p. 2675.
Singh, R. J., 1983, Microscopic study of rocks and minerals in introductory geology courses: Journal of Geological Education, v. 31, p. 356.
Strange, A., 1983, Put some color in your microscope: the Science Teacher, v. 50, p. 21.
Turnbull, D., 1950, Kinetics of heterogeneous nucleation: Journal of Chemical Physics, v. 18, p. 198.
Wahlstrom, E.E., 1979, Optical crystallography: John Wiley and Sons, fifth edition, 345 p.
Wasson, J.T., 1974, Meteorites: Classification and Properties: Springer-Verlag, first edition, 316 p.
Weisberg, M.K., 1987, Barred olivine chondrules in ordinary chondrites: Proceedings of the 17th Lunar Planetary Science Conference in Journal of Geophysical Research, v. 92, p. E663.
Wisman, J.A., 1976, Rapid, inexpensive, black and white 35 mm transparencies: Journal of Geological Education, v. 24, p. 9.
Wood, J.A., 1968, Meteorites and the origin of Planets: McGraw-Hill Book Company, New York, first edition, 117 p.
Wood, J.A., 1984, On the formation of meteoritic chondrules by aerodynamic drag heating in the solar system: Earth Planetary Science Letters, v. 70 , p. 11.
Wood, J.A., 1988, Chondritic meteorites and the solar nebula: Annual Reviews of Earth Planetary Science, v. 16, p. 53.
Wu, M.K., Ashburn, J.R., Torng, C.J., Hor, P.H., Meng, R.L., Gao, L., Huang, Z.J., Wang, Y.Q., and Chu, C.W., Superconductivity at 93K in a new mixed-phase Y-Ba-Cu-O compound system at ambient pressure: Physical Review Letters, v. 58, p. 908
Yagi, T., Mao, H.-K., and Bell, P. M., Structure and crystal chemistry of perovskite-type MgSi03: Physics and Chemistry of Minerals, v. 3, p. 97.