
Optical Birefringence
Many transparent solids, such as glass, are optically isotropic, which means that their index of refraction is equal in all directions throughout the crystalline lattice of the substance. Table salt, or sodium chloride, is also isotropic and is illustrated below in Figure 1(a). Notice, the substance possesses a simple crystalline lattice structure that is cubic and the sodium and chloride ions are arranged with uniform spacing along three mutually perpendicular axes. Each chloride ion is surrounded by, and electrostatically bonded to, six individual sodium ions and each sodium ion is similarly surrounded by chloride ions.
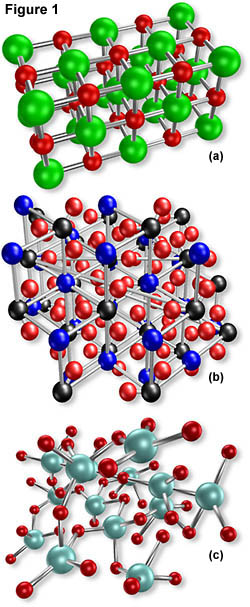
However, the other molecular models in Figure 1 illustrate more complex lattice structures. For instance, the lattice structure featured in Figure 1(b) is representative of the mineral calcite, also known as calcium carbonate, which consists of calcium and carbonate ions. Calcite has an anisotropic crystalline lattice and, therefore, interacts with light in a completely different manner than sodium chloride and other isotropic crystals. The polymer illustrated in Figure 1(c) interacts with light in yet another way since it is amorphous and devoid of any recognizable crystalline structure. However, polymers often possess some degree of crystalline order and may or may not be optically transparent.
Crystals may be classified as either isotropic or anisotropic depending upon their optical behavior and whether or not their crystallographic axes are equivalent. All isotropic crystals have equivalent axes that interact with light in a similar manner, regardless of the crystal orientation with respect to incident light waves. Moreover, light entering an isotropic crystal is refracted at a constant angle and passes through the crystal at a single velocity without being polarized by interaction with the electronic components of the crystalline lattice.
Anisotropic crystals, on the other hand, have crystallographically distinct axes and interact with light in a manner that is dependent upon the orientation of the crystalline lattice with respect to the incident light. When light enters the optical axis of anisotropic crystals, it acts in a manner similar to its interaction with isotropic crystals, passing through at a single velocity. However, when light enters a non-equivalent axis, it is refracted into two rays, each polarized so that they travel at different velocities and that their vibration directions are oriented at right angles to one another. This phenomenon is termed "double" or "bi" refraction and is seen to a greater or lesser degree in all anisotropic crystals.
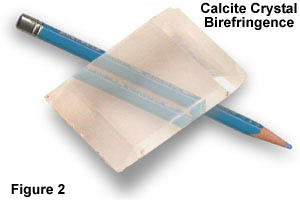
One of the most dramatic demonstrations of double refraction occurs when an object is viewed through calcite crystals, as illustrated above in Figure 2. The rhombohedral cleavage block of calcite featured in the example produces two images when it is placed over the blue pencil. One of the images appears as would be expected when viewing an object through clear glass or an isotropic crystal. The other pencil image appears displaced, due to the nature of doubly-refracted light.
| Interactive Java Tutorial | |||||||||||
|
|||||||||||
As discussed above, when double refraction occurs in an anisotropic crystal, light travels at two different speeds. One of the resulting polarized rays travels through the crystal with the same velocity in every direction and is termed the ordinary ray. The other ray travels with a velocity that is dependent upon the propagation direction within the crystal. This light ray is termed the extraordinary ray. The distance of separation between the ordinary and extraordinary ray increases with increasing crystal thickness.
The two independent refractive indices of anisotropic crystals are quantified in terms of their birefringence, a measure of the difference in refractive index. Thus, the birefringence (B, often termed d, or D) of a crystal is defined as:
where n(high) is the largest refractive index and n(low) is the smallest. This expression holds true for any part or fragment of an anisotropic crystal except for the instance in which light waves are propagated along the optical axis of the crystal.
The behavior of anisotropic crystals is particularly interesting when viewed under polarized illumination in a polarizing microscope. Figure 3 below, in which a birefringent crystal is placed between two polarizers whose vibration directions are perpendicular to each other, illustrates such a case.
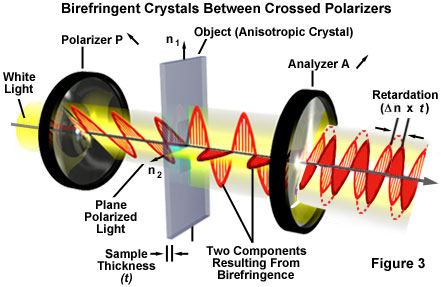
White light entering the polarizer on the left in Figure 3 is polarized with an orientation in the direction indicated by the arrow (next to the polarizer label) and is arbitrarily represented by a red sinusoidal light wave. Next, the polarized light enters the anisotropic crystal where it is refracted and divided into two separate components that vibrate parallel to the crystallographic axes and perpendicular to each other. The polarized light waves then travel through the analyzer, which passes only those components of the light waves that are parallel to its polarization direction (indicated by the arrow next to the analyzer label). The retardation of one ray with respect to another, a concept explained in more detail below, is indicated by Dn x t, the difference in speed between the ordinary and extraordinary rays refracted by the anisotropic crystal.
The following is another example of how birefringent anisotropic crystals interact with polarized light in an optical microscope. This time, the material is a hypothetical tetragonal crystal having an optical axis oriented parallel to the long axis of the crystal. Figure 4 illustrates the crystal as it would appear in the eyepieces of a microscope under crossed-polarized illumination. In each part of Figure 4, the axis of the microscope polarizer is indicated by a P and is oriented in an East-West direction. The axis of the microscope analyzer is indicated by an A and is oriented in a North-South direction. These axes are perpendicular to each other and result in a totally dark field when viewed through the eyepieces without insertion of a birefringent crystal.
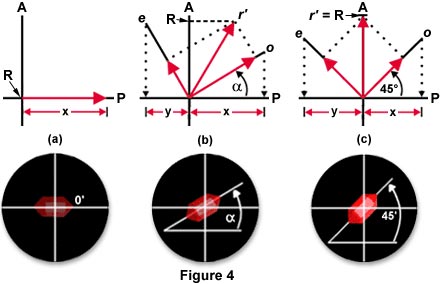
Figure 4(a) illustrates an anisotropic birefringent crystal that has its long (optical) axis oriented parallel to the direction of the polarizer. In this case, light passing through the polarizer, and subsequently through the crystal, is vibrating in a plane that is parallel to the direction of the polarizer. Due to the single direction of light vibration, there is no contribution from light passing through the analyzer. Thus, the crystal appears very dark and almost invisible. Microscopists classically refer to this orientation as being a position of extinction for the crystal. The crystal in 4(a), however, is not totally extinct as it would normally be between crossed polarizers, but passes a small portion of red light. This was done for illustration purposes only to allow visitors to note the position of the crystal.
The concept of the position of extinction is particularly important in determining the refractive indices of anisotropic materials with a polarizing microscope. By removing the analyzer in a crossed polarizing microscope, the single permitted vibration direction of light passing through the polarizer interacts with only one electrical component in the birefringent material. Therefore, a single refractive index may be segregated for measurement purposes. The remaining refractive index of the material can then be measured by rotation of the polarizer by 90 degrees.
| Interactive Tutorial | |||||||||||
|
|||||||||||
The situation is very different in Figure 4(b), where the long (optical) axis of the crystal is positioned at an angle (a) with respect to the polarizer. In this circumstance, a portion of the light received through the polarizer is passed on to the analyzer. The birefringent crystal, therefore, displays some order of brightness.
In order to quantify the amount of light that reaches the analyzer and the consequential brightness of the crystal in this example, simple vector analysis may be utilized. This method assumes the arbitrary value of 1 for both o and e, which are proportional to the actual intensities of the ordinary and extraordinary ray. The first step of obtaining an illumination value is to find the contributions from the polarizer to o and e. This can be accomplished by dropping projections of the vectors onto the axis of the polarizer (P), which results in the values x and y, as illustrated in Figure 4(b). These lengths should then be measured on the vectors o and e (shown as red arrows on the vectors) to produce the resultant r', which is projected onto the analyzer axis (A) as the absolute value R. The value of R on the analyzer axis is proportional to the amount of light passing through the analyzer.
| Interactive Tutorial | |||||||||||
|
|||||||||||
The maximum brightness for a birefringent material viewed through a polarizing microscope occurs when the long (optical) axis of the crystal is oriented at a 45 degree angle to both the polarizer and analyzer, as illustrated in Figure 4(c). In order to quantify the level of brightness, the same method of vector analysis that was explained previously may be utilized again. By dropping the projections of the vectors o and e onto the polarizer axis (P), the contributions of the polarizer to these vectors may be determined. When these projections are then measured on the vectors (again shown as red arrows on the vectors) and the rectangle is completed so that the resultant value r' may be computed, it becomes apparent that the maximum possible amount of light passed through to the analyzer takes place in this system. This same method will work for the orientation of any crystal with respect to the polarizer and analyzer axes since o and e are always at right angles to each other, the only difference being the orientation of o and e with respect to the crystal axes.
After they pass through a birefringent crystal, the ordinary and extraordinary rays remain oriented so that they are vibrating at right angles to each other. Each ray encounters a slightly different electrical environment (refractive index) as it enters the crystal, however, which affects the velocity at which they pass through the crystal. Due to the difference in refractive indices, one ray will travel through the crystal at a slower rate than the other ray. In other words, the velocity of the slower ray will be retarded with respect to the faster ray. This retardation can be quantified using the following equation:
or
G = t x |nhigh - nlow|
where G is the quantitative retardation of the material, t is the thickness of the birefringent crystal (or material) and B is birefringence as defined previously. Thus, factors contributing to the value of retardation are the magnitude of the difference in refractive indices in the environments encountered by the ordinary and extraordinary rays, as well as the thickness of the sample. As a rule, the greater the thickness or difference in refractive indices, the greater the degree of retardation.
Although when the extraordinary and ordinary rays emerge from the birefringent crystal they are vibrating at right angles with respect to one another, once they pass through the analyzer they vibrate in the same plane, as illustrated in Figure 3 above. However, since one wave is retarded with respect to the other, interference occurs between the waves as they pass through the analyzer. The net result of this interference, which may be constructive or destructive, is that some birefringent samples acquire a spectrum of color when observed in white light through crossed polarizers.
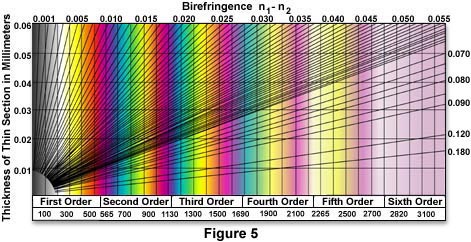
Quantitative assessment of the colors seen in birefringent samples is commonly provided by means of a Michel-Levy chart, like the one illustrated in Figure 5 above. As is evident from the graph, the polarization colors seen in the microscope can be correlated with the actual retardation, thickness, and birefringence of the sample. The chart is simple to use with birefringent samples if two of the three key variables are known. For instance, when a sample is placed between crossed polarizers in the microscope and rotated to a position of maximum brightness, the color produced by the sample can be traced down on the retardation axis to find the wavelength difference between the ordinary and extraordinary ray of the sample. Alternatively, by measuring the refractive indices of the sample and calculating their difference to determine the birefringence (B), the color of the sample can be determined from the values along the top of the chart. Also, by extrapolating the angled lines back to the ordinate, the thickness of the sample can be calculated.
The bottom section of the Michel-Levy chart marks the orders of retardation in multiples of approximately 550 nanometers. The area between zero and 550 nanometers is known as the first order of the polarization colors, and the magenta color that occurs in the 550 nanometer region is often called first-order red. Colors between 550 and 1100 nanometers are termed second-order colors, and so on up the chart. The black color at the beginning of the chart is called zero-order black. Most Michel-Levy charts plot colors up to the fifth or sixth order, as does the one illustrated in Figure 5.
| Interactive Java Tutorial | |||||||||||
|
|||||||||||
When polarization colors are of low order they may be hard to identify without the aid of contrast enhancing accessories. For instance, the most sensitive area of the Michel-Levy chart is first-order red (550 nanometers), since even a slight change in retardation causes the color to shift dramatically either up to cyan or down to yellow. Many microscope manufacturers compensate for this sensitivity by providing a full-wave retardation plate or first-order red compensator with their polarizing microscopes in order to assist scientists in determining the properties of birefringent materials.
Contributing Authors
Mortimer Abramowitz - Olympus America, Inc., Two Corporate Center Drive., Melville, New York, 11747.
Shannon H. Neaves and Michael W. Davidson - National High Magnetic Field Laboratory, 1800 East Paul Dirac Dr., The Florida State University, Tallahassee, Florida, 32310.
BACK TO POLARIZED LIGHT MICROSCOPY