Michel-Levy Birefringence Chart
|
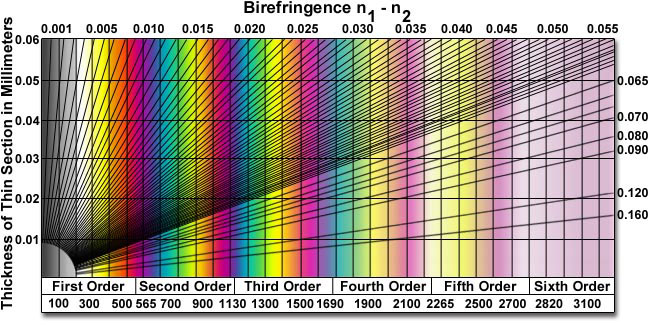
The birefringence of a anisotropic material can be estimated when observed and/or photographed in a polarized light microscope. A relationship between interference color and retardation can be graphically illustrated in the classical Michel-Levy interference color chart, presented above. This graph plots retardation on the abscissa and specimen thickness on the ordinate. Birefringence is determined by a family of lines that emanate radially from the origin, each with a different measured value of birefringence corresponding to thickness and interference color. The Michel-Levy chart is utilized by comparing the highest-order interference colors displayed by the specimen in the microscope to those contained on the chart. Once the appropriate color has been located, the nearest vertical line along the interference color is followed to the nearest horizontal line representing the known thickness. Birefringence is determined by selecting the diagonal line crossing the ordinate at the intersection of the specimen interference color and thickness value. Contributing Authors Mortimer Abramowitz - Olympus America, Inc., Two Corporate Center Drive., Melville, New York, 11747. Michael W. Davidson - National High Magnetic Field Laboratory, 1800 East Paul Dirac Dr., The Florida State University, Tallahassee, Florida, 32310. |
© 1995-2025 by Michael W. Davidson and The Florida State University. All Rights Reserved. No images, graphics, software, scripts, or applets may be reproduced or used in any manner without permission from the copyright holders. Use of this website means you agree to all of the Legal Terms and Conditions set forth by the owners.
This website is maintained by our
|