Galleria
License Info
Image Use
Custom Photos
Partners
Site Info
Contact Us
Publications
Home

Visit Science,
Optics, & You


The Galleries:

Photo Gallery
Silicon Zoo
Pharmaceuticals
Chip Shots
Phytochemicals
DNA Gallery
Microscapes
Vitamins
Amino Acids
Birthstones
Religion Collection
Pesticides
BeerShots
Cocktail Collection
Screen Savers
Win Wallpaper
Mac Wallpaper
Movie Gallery

Lorentzian LineShapes

In an ideal case, each transition in an NMR spectrum will be represented by a Lorentzian lineshape. That is because Lorentzian functions are related to decaying sine and cosine waves, that which we experimentally detect.

Below, you can watch how the oscillation frequency of a detected signal translates into a frequency shift in the corresponding Lorentzian. In addition, notice how it is the decay rate of the detected signal that relates to the width of the Lorentzian.

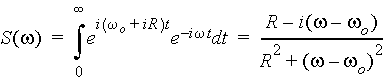
Above, the decaying oscillation would be one of many similar oscillations simultaneously detected in a pulsed NMR experiment. This collection of oscillations is called a Free Induction Decay (FID) and represents the spectrum in the time domain. More useful is the spectrum in the Frequency domain, where each.

The conversion between the (time domain) FID and (frequency domain) spectrum is typically performed using a Fourier transform. using our oscillating decay

BACK TO ELECTRICITY & MAGNETISM TUTORIALS

Questions or comments? Send us an email.
© 1995-2022 by Michael W. Davidson and The Florida State University. All Rights Reserved. No images, graphics, software, scripts, or applets may be reproduced or used in any manner without permission from the copyright holders. Use of this website means you agree to all of the Legal Terms and Conditions set forth by the owners.
This website is maintained by our
Graphics & Web Programming Team
in collaboration with Optical Microscopy at the
National High Magnetic Field Laboratory.
Last Modification: Friday, Mar 31, 2017 at 10:43 AM
Access Count Since June 16, 1999: 60197