Fluorescence Digital Image Gallery
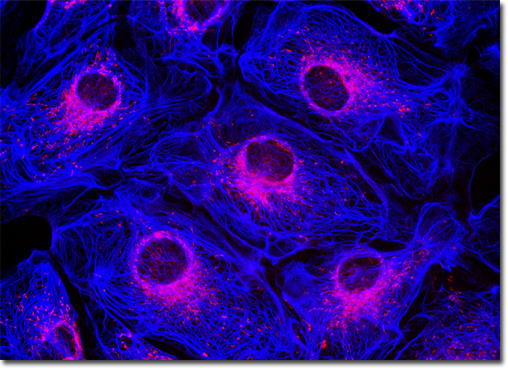
Male Rat Kangaroo Kidney Epithelial Cells (PtK2)
|
Instrumentally, fluorescence emission collection can be optimized by careful selection of objectives, detector aperture dimensions, dichromatic and barrier filters, as well as maintaining the optical train in precise alignment. In most cases, low magnification objectives with a high numerical aperture should be chosen for the most demanding imaging conditions because light collection intensity increases as the fourth power of the numerical aperture, but only decreases as the square of the magnification. However, the most important limitations in light collection efficiency in confocal and fluorescence microscopy arise from restrictions imposed by the physical properties of the fluorophores themselves. Indeed, fluorescent probe development is limited by a lack of knowledge of the specific molecular properties responsible for producing optimum fluorescence characteristics, and the design rules are insufficiently understood to be helpful as a guide to the development of more efficient fluorophores. The current success in development of new fluorescent probes capable of satisfactory performance is a testament to the progress made through use of empirical data and assumptions about molecular structure extrapolated from the properties of existing dyes, many of which were first synthesized over a hundred years ago. The adherent rat kangaroo kidney cell culture presented in the digital image above was immunofluorescently labeled with primary anti-cytokeratin (pan) mouse monoclonal antibodies followed by goat anti-mouse Fab fragments conjugated to Marina Blue. The specimen was simultaneously stained with MitoTracker Red CMXRos to label the mitochondrial network. Images were recorded in grayscale with a QImaging Retiga Fast-EXi camera system coupled to an Olympus BX-51 microscope equipped with bandpass emission fluorescence filter optical blocks provided by Omega Optical. During the processing stage, individual image channels were pseudocolored with RGB values corresponding to each of the fluorophore emission spectral profiles. |
© 1995-2025 by Michael W. Davidson and The Florida State University. All Rights Reserved. No images, graphics, software, scripts, or applets may be reproduced or used in any manner without permission from the copyright holders. Use of this website means you agree to all of the Legal Terms and Conditions set forth by the owners.
This website is maintained by our
|