Fluorescence Digital Image Gallery
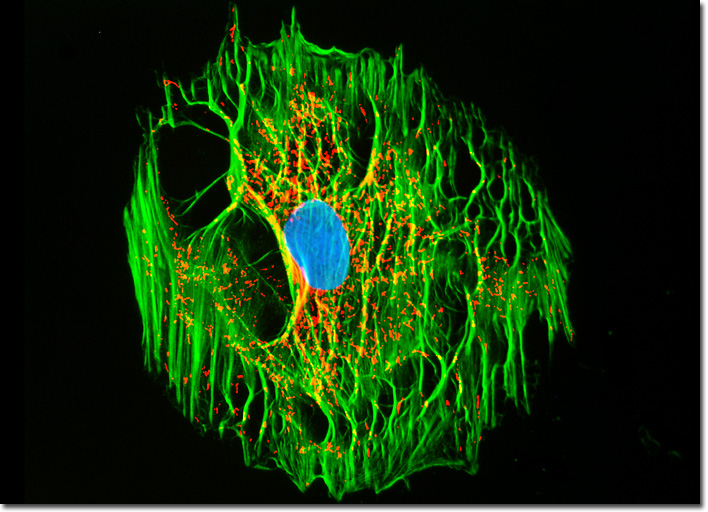
Embryonic Rat Thoracic Aorta Medial Layer Myoblast Cells (A-10)
|
Within animal cells, actin filaments are organized into various types of bundles and gel-like networks. The form that the cytoskeletal filaments take is dependent on the function they are designed to accomplish and the type of proteins that bind them together. For instance, in the core of the thin cell surface protrusions termed microspikes, actin filaments are organized into tight parallel bundles by the bundling protein fimbrin, which features actin-binding sites that are located in close proximity to one another in the polypeptide chain. Bundles of actin filaments are less tightly packed together when they are associated with other parts of the cell, such as stress fibers, and are bound by alpha-actinin or other crosslinkers with actin-binding domains spaced further apart. Also, if the cross-linking proteins exhibit a bent connection between their binding sites, a web network or actin filament gel forms rather than parallel bundles. One of the most widely known gel-forming proteins is spectrin, a flexible tetramer that is localized in the cell cortex directly underneath the plasma membrane in some vertebrate cells, where it binds short actin filaments into a structurally important supportive web. Applying a popular triple fluorophore combination, the adherent log phase culture of rat thoracic aorta cells illustrated above was treated with MitoTracker Red CMXRos in growth medium for one hour, washed and fixed with paraformaldehyde (prepared in growth medium), permeabilized, and blocked with bovine serum albumen. The cells were subsequently labeled with Oregon Green 488 conjugated to phalloidin and counterstained with Hoechst 33258. Images were recorded in grayscale with a QImaging Retiga Fast-EXi camera system coupled to an Olympus BX-51 microscope equipped with bandpass emission fluorescence filter optical blocks provided by Omega Optical. During the processing stage, individual image channels were pseudocolored with RGB values corresponding to each of the fluorophore emission spectral profiles. |
© 1995-2025 by Michael W. Davidson and The Florida State University. All Rights Reserved. No images, graphics, software, scripts, or applets may be reproduced or used in any manner without permission from the copyright holders. Use of this website means you agree to all of the Legal Terms and Conditions set forth by the owners.
This website is maintained by our
|