
Polarized Light Microscopy
Introduction to Biological Polarization
Microscopy
(Part 1)
Investigating fine structural details of a living cell as it undergoes physiological changes or experimental alterations poses a unique collection of special problems for the biological microscopist. Electron micrographs reveal fine structural detail and organization quite well, but require thin sections of fixed cells.
Time-lapsed photomicrography, digital imaging, and videography demonstrate the continually changing shape and distribution of organelles in living cells, but in most light microscopy applications, fine details in the 0.1 to 100 nanometer range (a size distribution from atoms to macromolecular aggregates) are beyond optical capabilities of light microscopes.
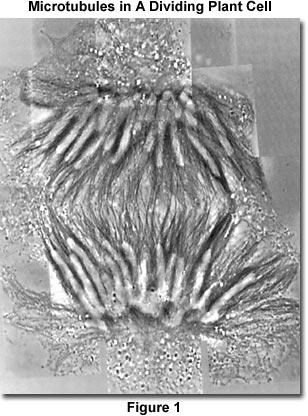
A dramatic example of birefringence in biological specimens captured with polarized light microscopy is presented in Figure 1, which illustrates a montage of microtubules in the mitotic spindle of a dividing plant cell. The anisotropic Tyndall scattering of the microtubules (which are 25 nanometers in diameter and coated with antibody-conjugated, 5-nanometer gold spheres) was visualized in crossed polarized illumination with a 1/18-lambda compensator in subtractive orientation and enhanced digitally. A 63x Plan Apochromatic objective having a numerical aperture of 1.4 was employed together with a rectified condenser (numerical aperture of 1.35) illuminated with the 546-nanometer emission from a 100-watt mercury arc lamp through a light scrambler to uniformly fill the condenser aperture. The optical sections are so thin that two sets of montages taken only a micron apart demonstrate distinct differences in the distribution of microtubules.
Principles of wave optics dictate that the resolution of a light microscope is limited by its numerical aperture (NA) and the wavelength of light based on the Rayleigh equation for the limits of optical resolution:
| d = 1.22 l0/(NAobj + NAcond) | (1) |
where d is the minimum distance between closely spaced detail that can be resolved in the specimen, l(0) is the wavelength of the light in air, NA(obj) is the numerical aperture of the objective lens, and NA(cond) is the working numerical aperture of the condenser. On the other hand, the electron microscope with its very high resolution (1-2 nanometers for many biological specimens) does not permit nondestructive study of cells.
An effective mechanism for bridging this gap is to take advantage of the anisotropic optical properties often exhibited by the components present in cellular fine structure. Anisotropic optical properties, such as birefringence and dichroism, can be employed to measure molecular and fine structural anisotropy. These properties, which occur at a very low level in living organisms, can be studied nondestructively in individual living cells using a sensitive polarizing microscope, so that fine structural changes in small parts of a single cell may be followed over time.
From equation (1), the smallest distance resolvable with any microscope having a 1.40 numerical aperture objective (with a closely matched condenser of equivalent numerical aperture at a wavelength of 550 nanometers) is approximately 200 nanometers or 0.2 micrometers. With a sensitive polarizing microscope, changes in fine structure or molecular alignment are detectable with each resolvable unit area that is smaller than 0.2 x 2 micrometers, or less than a square micrometer.
Anisotropy
Anisotropy, the non-uniform spatial distribution of properties, describes those properties of matter that have different values when measurements are made in several directions within the same material. The opposite, isotropic properties, remain the same, regardless of the direction of measurement. The grain in wood provides a good model for demonstrating anisotropy, partly because wood is much stronger in a direction parallel to the grain than it is across the grain. As the humidity changes, wood shrinks and swells across the grain to a much greater degree than it does along the length of the grain. All timber jacks and loggers know that wood splits more easily along the grain axis. In these familiar examples, we might have anticipated the anisotropic properties of wood grain structure, but there are other anisotropic properties that are not quite so obvious.
Related to the fact that it is more difficult to stretch wood along the grain than across the grain (that is, the coefficient of elasticity is greater parallel to the grain than across), sound waves travel faster parallel to the grain than across the grain. Depending on the type of wood, the velocity of sound may be up to three times as great when sound is traveling parallel to the wood grain than across the grain.
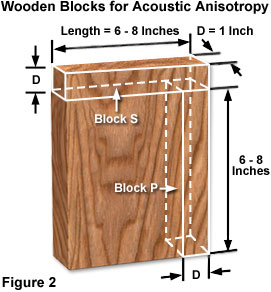
Two blocks of wood cut from the same plank and finished to identical dimensions can be used to demonstrate this phenomenon (Figure 2). Blocks P and S are the same length and width, but P is cut parallel to the grain while S is cut across the grain. Gently holding on to the middle of the block and tapping one end with a steel ball mounted on a flexible handle generates a standing wave. The compressive sound wave travels back and forth rapidly, and because the ends of the wooden blocks are open, a longitudinal standing wave is formed with loops at the ends of the block and a node in the middle. The standing wave takes on a particular pitch or tone. The tone, or frequency of the standing wave, reveals how quickly the wave is traveling in the block. Tones formed from sound waves traveling parallel to the grain are higher because the waves are moving faster than those formed across the grain.
In the example presented in Figure 2, the frequency of the standing wave generated by gently holding onto the middle of the block and tapping (with a steel ball having a flexible handle) from an end, measures the acoustic velocity for the compressive wave that travels through the block. For this experiment, consisting of 8-inch blocks made of hard oak, the standing wave formed in block P resonates at 4500 Hertz while the corresponding wave in block S resonates at only 2500 Hertz. Therefore, the compressive sound wave travels nearly two times faster parallel to the grain than across. This is a dramatic demonstration of acoustic anisotropy, or the anisotropic propagation of sound waves, and how structural anisotropy can relate to wave propagation.
| Interactive Java Tutorial | |||||||||||
|
|||||||||||
In the wood model, the grain structure is clearly visible, and it is therefore not difficult to grasp the reason for the anisotropy. However, anisotropy can exist even if the heterogeneous structures are not visible. The anisotropic properties can lie in a material that appears homogeneous at the microscopic level but which is anisotropic at the atomic or molecular level.
Basic Features of Light Waves
Before discussing anisotropy further, a basic review of several principles of physical optics necessary to subsequent discussions is required. Light is a form of electromagnetic wave. If a capacitor is charged (Figure 3) and a spark is discharged through the two electrodes, the current induced by the spark flows down for a short time, slows down, but because of the inductance of the circuit, flows back upwards, recharging the capacitor again.
The propagation of an electromagnetic wave, which has been generated by a discharging capacitor or oscillating molecular dipole, is illustrated by Figure 3. The spark current oscillates at a frequency (n) characteristic of the circuit. The electromagnetic disturbance that results is propagated with the electronic (E) and magnetic (H) vectors vibrating perpendicularly to each other and to the direction of propagation (Z). The frequency, n, is determined by the oscillator and the wavelength is determined by the oscillation frequency divided by the velocity of the wave.
The current oscillates back and forth at a frequency (n) that is characteristic of the circuit. The electric current oscillating up and down in the spark gap creates a magnetic field that oscillates in a horizontal plane. A changing magnetic field, in turn, induces an electric field so that a series of electrical and magnetic oscillations combine in a formation that propagates as an electromagnetic wave.
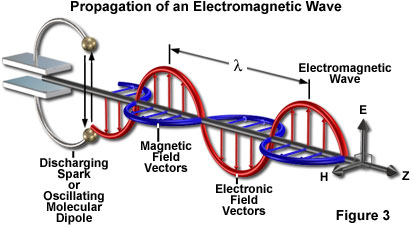
The electric field in an electromagnetic wave vibrates with its vectorial force growing stronger and then weaker, pointing in one direction, and then in the other direction, alternating in a sinusoidal pattern (Figure 3). At the same frequency, the magnetic field oscillates perpendicular to the electric field. The electric and magnetic vectors, reflecting the amplitude and the vibration directions of the two waves, are oriented perpendicular to each other and to the direction of wave propagation.
The velocity of the resulting electromagnetic wave can be deduced from the relationships defining the electric and magnetic field interactions. Maxwell's equations prove that velocity equals the speed of light in a vacuum (c; equal to 30 billion centimeters per second) divided by the square root of the dielectric constant (x) of the medium times the magnetic permeability (m) of the medium. Thus,
| (2) |
For most materials that occur in living cells (some of which are non-conducting), the magnetic permeability is equal to a value of unity, so that:
| (3) |
Empirically, the velocity of light is known to be inversely proportional to the refractive index (n) of the material through which it propagates, therefore:
u = c/n |
(4) |
From equations (3) and (4), the conclusion can be drawn that refractive index is equal to the square root of the dielectric constant of that material if the measurements are made at the same frequency:
| (5) |
Equation (5) reveals that optical measurements are, in fact, measurements of the electrical properties of the material. The dielectric properties, in turn, directly reflect the arrangement of atoms and molecules that define a substance.
| Interactive Java Tutorial | |||||||||||
|
|||||||||||
The vector describing the interaction between an electromagnetic field and a substance lies in the same direction as the electric vector. This is true regardless of whether the electric or magnetic vectors are considered, because what matters is the effect of the electric or magnetic fields on the electrons in the material medium (the magnetic field affects those electrons that move in a plane perpendicular to the magnetic field). Elsewhere in this discussion, the vibrations of an electromagnetic wave will be indicated only by the direction of the electric field. The magnetic field is still present, perpendicular to the electric field, but will not represented in the vector diagrams from this point on, in order to avoid confusion.
Optical Anisotropy
The dielectric constant is anisotropic in many substances. Take a cube of such a substance and place it on a Cartesian coordinate, with the sides of the cube parallel to the x, y, and z axes. The dielectric constant for an electric field measured along the x axis -- that is, x measured by placing the plates of a capacitor on the faces of the cube parallel to the y-z plane (the plane that contains the y and z axes, or that is perpendicular to the x axis) -- would have one value, x(x). Along the y axis, it would have another value, x(y), and along the z axis, a third value, x(z).
The square roots of these three dielectric constants are now taken and made the length of the x, y, and z axes, proportional to these values. An ellipsoid (known as the Fresnel ellipsoid) is then drawn that has radii coinciding with the x, y, and z axes as just defined (Figure 4). The Fresnel ellipsoid describes the dielectric properties of a material when they are measured in all directions. Each radius provides the dielectric constant square root value for an electromagnetic wave that has an electric vector laying in the direction of that radius.
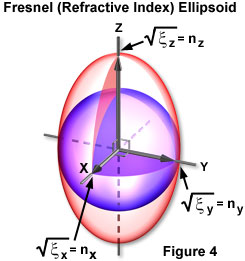
Presented in Figure 4 is a diagrammatic illustration of a refractive index, or Fresnel, ellipsoid. The radius of the ellipsoid yields the refractive index (n), or the square root of the dielectric constant for waves whose electric displacement vectors lie in the direction of the radius of the ellipsoid within an anisotropic medium. A cross section through the center of the ellipsoid produces a refractive index ellipse for waves traveling normal to that section. The major and minor axes of the ellipse denote the refractive indices encountered by the slow and fast waves, which vibrate with their electric displacement vectors along those two axes.
Because the square root of the dielectric constant equals the refractive index (from equation (5)), the Fresnel ellipsoid is in fact a refractive index ellipsoid. As illustrated in Figure 4, the square root of the x-component dielectric constant represents the refractive index for electromagnetic waves whose electric field vectors are vibrating in the x-axis direction. It also follows that the square root of the dielectric constant for the y and z components corresponds to waves with electric fields vibrating along the y and z axes, respectively.
| Interactive Java Tutorial | |||||||||||
|
|||||||||||
The value of the refractive index given by the radius of the Fresnel ellipsoid is valid for all waves with an electric vector that vibrates in the direction of that radius, regardless of the wave's direction of propagation. For example, waves with their electric vector in the x-axis direction may be propagating along the y-axis or z-axis. Therefore, given the direction of the electric vector (or more properly, the electric displacement vector in the material medium), the refractive index suffered by a wave is defined regardless of its direction of propagation.
Birefringence
The Fresnel ellipsoid is used to obtain an index ellipse by cutting a cross-section of the three-dimensional ellipsoid perpendicular to the direction of light propagation. For light traveling in any direction, the index ellipse is obtained by making a major cross section of the ellipsoidal perpendicular to that direction of travel. The index ellipse yields the refractive indices and indicates the vibration direction (of the electric vector) of the light waves, because the waves vibrate with the electric vectors along the major and minor axes of the index ellipse. The refractive indices that the two waves experience are given by the major and minor radii of the ellipse. In other words, for each direction of travel in an anisotropic medium, there are two plane-polarized light waves that vibrate perpendicular to each other and travel at different velocities. This is, in fact, the phenomenon of birefringence.
As light travels through an anisotropic material, the wave gets split into two vibrations. The two vibrations (remember that only the electric vector directions and not the magnetic vectors are being considered) are mutually perpendicular to each other and perpendicular to the direction that the wave propagates. The wave whose electric vector vibrates along the major axis of the index ellipse is called the slow wave, because the refractive index for this wave is greater than the refractive index for the other wave (see equation (4) for the relation of the refractive index to the phase or velocity of travel). The wave vibrating perpendicular to the slow wave is termed the fast wave.
Each index ellipse then provides the slow and fast vibration axes for waves traveling perpendicular to the plane of the ellipse. The index ellipse (the cross section of the index ellipsoid) is commonly employed to designate the birefringence of a material observed with light propagating perpendicular to that plane.
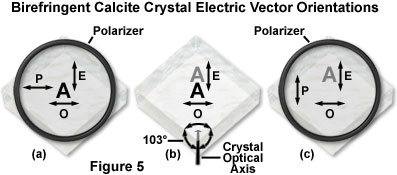
Another manifestation of birefringence is demonstrated by taking a piece of white paper having a single letter A drawn on the paper, and covering the letter with a small crystal of calcite, a form of calcium carbonate with a rhomboidal crystalline structure (Figure 5(b)). When the calcite crystal is placed on top of the letter, the image observed through the crystal is doubled. As the crystal is slowly rotated about the letter, one of the images of the letter remains stationary, while the other precesses around the first.
Presented in Figure 5(b) is the double image of the letter A observed through a calcite crystal. As the crystal is turned, the extraordinary (e) ray image precesses around the ordinary (o) ray image. The extraordinary wave vibrates in the plane that includes the c-axis (the principle section through the crystal) and the ordinary wave vibrates perpendicular to it. The optical axis of the crystal is indicated by c, which in calcite represents the axis of threefold symmetry. The optical axis makes an equal angle with all three of the crystal faces that join at the two corners, where all edges lie at 103-degree angles with each other. The c-axis lies in the direction of the semi-ionic bond that links the planar carbonate groups and calcium atoms in the calcite (calcium carbonate) lattice.
| Interactive Java Tutorial | |||||||||||
|
|||||||||||
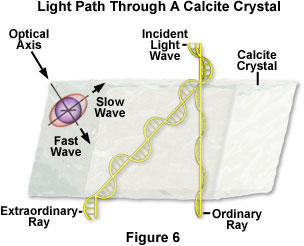
The phenomenon of image splitting and precession is explained by the birefringence of calcite. In fact, birefringence in calcite is so strong that not only are there two waves, but even the directions of the two waves become separated (Figure 6). One of the waves, the ordinary ray, travels straight through, with its image remaining stationary when the crystal is turned. This ray is termed the ordinary ray because it behaves (is refracted) in an ordinary fashion. The other wave, the precessing one, refracts in an extraordinary fashion, and is thus termed the extraordinary ray.
Presented in Figure 6 is the path of light rays through a calcite crystal. The crystal is illustrated with the optical axis traveling from the upper left hand corner. The ordinary light ray is refracted without any deviation from normal incidence as if traveling through an isotopic medium. The extraordinary ray direction deviates in the principal section, even for normal incidence, hence the name. The c-axis is the axis of symmetry of the index ellipsoid, depicted near the upper left hand corner. Calcite is a negatively birefringent crystal, rendering the ordinary ray the slow wave, which always vibrates in a plane perpendicular to the principal section. In contrast, the extraordinary wave vibrates in the principal section along the direction of the optical axis. Not only is the light split into two, but each ray vibrates in a unique direction, with the electric vectors perpendicular to each other. The extraordinary ray always vibrates in the plane that joins it and the ordinary ray, and the ordinary ray always vibrates at right angles to this direction.
When the crystal is oriented such that the precessing extraordinary ray image appears on top (see Figure 5), the direction of vibration of the extraordinary ray is in the direction joining it and the ordinary ray image, namely up and down. The ordinary ray's electric vector is horizontal. When the crystal is viewed through a polarizer that transmits waves with horizontally oscillating electric fields, the top image (generated by the extraordinary rays) should disappear. However, if the crystal is viewed through a polarizer that transmits only electric fields with vertical vibrations, the bottom image (generated by the ordinary rays) will disappear.
A useful tool for examination of polarized light is a pair of Polaroid sunglasses, which contain inexpensive sheets of polarized lens material. In ordinary light, these sunglasses show no apparent anisotropy, even when they are oriented in different directions. However, if one observes the surface of a body of water or the glare on a road or painted surfaces, the polarized reflected light is removed by the polarized lens material. Light that is reflected from the water surface (or other non-conducting material) is plane-polarized, especially at a particular angle of incidence, often termed the Brewster angle. Light reflected at the Brewster angle is polarized so the electric vector is vibrating parallel to the surface from which it was reflected, not perpendicular to that surface.
This behavior can be explained from a series of equations by Fresnel, but perhaps an easier method is to employ the stick model first proposed by Robert W. Wood. Consider a stick of wood in place of the electric vector. If the wood impacts a water surface at an angle, the stick slides into the water and is not reflected. However, if the stick lands parallel to the water surface, it can bounce back. Because in nature, horizontal surfaces are almost exclusively encountered, it will be a horizontal vibration that is reflected. To minimize or cut glare, Polaroid sunglasses are designed to remove the horizontal vibrations and transmit the electric vector that is vibrating vertically. Thus, polarized sunglasses, or the simple polarizing elements derived from them, represent a useful standard for transmission of the electric vector (see Figure 5).
| Interactive Java Tutorial | |||||||||||
|
|||||||||||
The concept of utilizing transparent polarized materials to determine the electric vector directions for the extraordinary and ordinary rays in calcite is presented in Figure 5(a) and (c). When the polarizing elements are oriented so that light waves having electric vectors in the vertical direction are transmitted, those waves having similar vectors in the horizontal direction are absorbed. Polarizers superimposed over calcite crystals in Figure 5(a) and (c) are oriented so that the vertical electric vectors are transmitted. The calcite crystal in Figure 5(a) is oriented so that the extraordinary ray is transmitted, but the ordinary ray is absorbed by the polarizer. At an intermediate angle (not illustrated), both images are partially transmitted following the cosine-squared law.
Returning to the calcite crystal, the image of the letter A in Figure 5(a) has a vertical extraordinary ray vector, and therefore, when viewed through a polarizer with vertical orientation, the bottom image (the letter A transmitted by the ordinary ray) will disappear. If either the crystal or polarizer is turned slowly, two images appear until the rotation angle reaches 90 degrees (Figure 5(c)). At this point the letter A formed by extraordinary light waves disappears and the one formed by ordinary light waves reaches its brightest intensity. Thus, with birefringence, a light beam is split into two waves traveling at different velocities, perpendicular to each other. Upon closer inspection, the image formed by the extraordinary ray appears farther through the crystal than the ordinary ray image, which indicates that the ordinary ray image has suffered greater refraction. In other words, the refractive index experienced by the extraordinary ray is less than that for the ordinary ray in calcite.
Calcite crystals can be used as very effective polarizers. In fact, Nicol, Glan-Thompson, Ahrens, and other prisms are made of calcite to isolate and transmit only one of the polarized waves. It is unfortunate that the wave transmitted by these otherwise superior polarizing materials is the extraordinary wave. The velocity of the extraordinary wave (or refractive index of the extraordinary ray) varies with direction of propagation. Calcite prisms introduce astigmatism unless all the beams travel parallel to each other through the crystal.
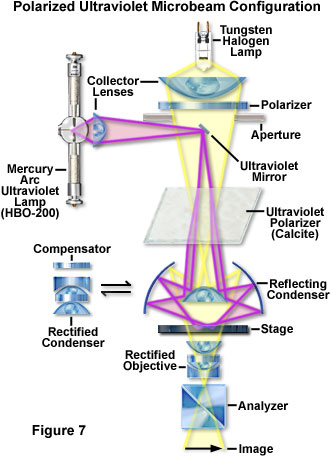
A schematic diagram of a polarized ultraviolet microbeam apparatus, utilized to observe weak birefringence in biological specimens, is illustrated in Figure 7. Each light ray from both the mercury arc ultraviolet source and the visible light tungsten halide lamp are split into extraordinary and ordinary rays by the ultraviolet polarizer (a calcite prism as described in detail later in this discussion). Ultraviolet light is reflected from a small, first-surface mirror mounted on a dovetail slider beneath the polarizer for visible light illumination. The ultraviolet polarizer is a cleaved crystal of calcite optically polished on the top and bottom faces. The reflecting condenser focuses the double image of the ultraviolet mirror and visible light source aperture diaphragm onto the specimen plane. The resulting image of the ultraviolet mirror with the desired polarization is superimposed on the specimen when it is subjected to microbeam analysis.
For ultraviolet microbeam work, it is much less expensive and more effective to use a simple cleaved piece of calcite crystal that has been optically polished on two opposite faces. When placed in front of the microbeam source, the crystal splits the beam into two components and provides two equally intense images of the microbeam source (schematically illustrated in Figure 7). The investigator can choose an image with known vibration (or use both) because the extraordinary ray, whose electric wave vibration joins the two images, can be identified by its precession when the crystal is rotated about the axis of the microscope. The ordinary ray vibration is perpendicular to the extraordinary ray vibration. The result is two polarized microbeam sources with equal intensities, which can be employed for analysis of birefringent biological materials. A good example is the arrangement of nucleotide base pairs in DNA.
Calcite will generally transmit down to the 240-nanometer wavelength region, but this depends on the properties of the crystal source and its purity. Some calcite crystals are able to transmit even shorter wavelengths. In optical materials such as calcite, the two beams are visibly split in two. However, for most materials, especially the cytoplasm or nuclear structures in a living cell, birefringence is so weak that the two beams are not visibly split. Even when they not visibly split, the ordinary and extraordinary waves are still present, with their individual vibration planes and separate velocities. In order to understand the birefringence properties of these two waves in living cells, it is important to examine another form of optical anisotropy, the molecular and atomic meaning of dichroism.
Dichroism
An excellent demonstration of dichroism can be obtained by placing a small source of light (such as a flashlight bulb) behind a polished tourmaline crystal. Tourmaline is a prismatic crystal with a threefold rotational symmetry, and the type employed for this demonstration is a clear green crystal. Tourmaline crystals are dichroic and transmit in the green (or blue) range of the visible light spectrum as long as the axis of symmetry is oriented perpendicular to the light beam, as illustrated in Figure 8. However, if the crystal is oriented so the view occurs down the axis of symmetry, no light, or very little light having a brownish tint, is transmitted.
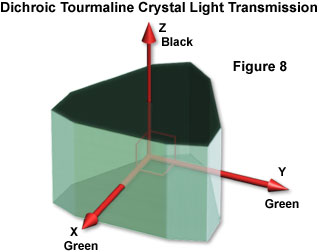
Transmission of light through a dichroic green tourmaline crystal is schematically represented in Figure 8. When viewed along the x and y axes, the crystal is transparent with a green hue. Viewed along the z axis, no light is transmitted and the crystal is black or very dark brown, even when the crystal is considerably shorter along the z axis than along the x and y axes.
The wave-optical basis of these observations can be understood by returning to an analysis similar to the one employed for birefringence. Dichroic crystals are also birefringent, so that light is again split into two waves by the crystal. As presented in Figure 9, for each direction of travel, the light wave is split into two waves, whose electric vectors are oriented perpendicular to each other and to the direction of propagation.
The waves propagating in Figure 9 offer an explanation of the dichroic absorption in tourmaline crystals. The x and y electric vectors are absorbed regardless of the direction of propagation through the crystal. Only the z vectors are not absorbed, so that the transmitted light is plane-polarized in a direction parallel to the z-axis. For light traveling along the z-axis, one wave (y) has the electric vectors vibrating in the y-z plane and another (x) has electric vectors vibrating in the x-z plane. Both of these must be absorbed because light does not penetrate through the z-axis. This means that the electronic disturbances caused by both the y electric vector and the x electric vector result in absorption of the energy. The chromophores in the crystal are oriented such that they absorb light waves whose electric fields are vibrating in the x-y plane.
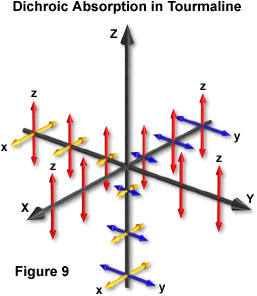
When examining light traveling along the x direction, it is now obvious that light must vibrate in the two orientations that are perpendicular: the z and y directions. Because the y vibration is absorbed, it follows that the green light observed must have its electric vector in the z direction. Likewise for the y propagation, the x electric vectors are absorbed and only the z vectors must comprise the transmitted green light. It can thus be concluded that light transmitted through the tourmaline crystal is plane-polarized with its electric vector parallel to the crystalline (z) axis of symmetry.
This conclusion is readily confirmed with linear polarizing materials, which are themselves synthesized with dichroic polymers. One common form utilizes a stretched film of polyvinyl alcohol impregnated with polyiodide crystals. In the stretched polymer film, the micelles and long-chain molecular backbones are oriented parallel to the direction of stretch. The needle-shaped, dichroic polyiodide crystals are deposited in the interstices, parallel to the stretched polymer molecules. All of the polyiodide crystals, therefore, become oriented parallel to each other, and one obtains a large sheet of dichroic material.
Thus, we have the basis for dichroism. Both dichroism and birefringence can be manifested as macroscopically recognizable optical properties, which vary with the propagation direction of light. However, at the same time, these properties are a reflection of fine-structural, molecular, or atomic anisotropies. For dichroism, it is the orientation of chromophores that determines anisotropic absorptions. For birefringence, it is the anisotropy of dielectric polarizabilities. The anisotropic polarizability can originate in the fine structure or within the molecules.
This concludes the first part of our discussion on biological polarized light microscopy. Please use the link provided below to navigate to part two of this section:
Author
Shinya Inoué - Marine Biological Laboratory, 7 MBL Street, Woods Hole, Massachusetts 02543.
BACK TO POLARIZED LIGHT MICROSCOPY