
Fluorescence Microscopy
Overview of Excitation and Emission Fundamentals
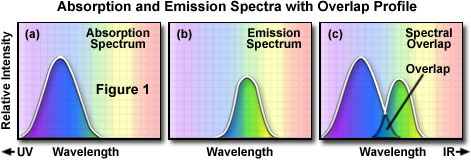
Because of their novel electronic configurations, fluorochromes have unique and characteristic spectra for absorption (usually similar to excitation) and emission. These absorption and emission spectra show relative Intensity of fluorescence, with relative intensity as the vertical axis versus wavelength as the horizontal axis.
For a given fluorochrome, the manufacturers indicate the wavelength for the peak of excitation/fluorescence intensity and the wavelength for the peak of emission/fluorescence intensity. It is important to understand the origin of the graphs/curves showing the excitation and emission spectra for a given fluorochrome.
To determine the emission spectrum of a given fluorochrome, the dye absorption maximum wavelength (usually the same as the excitation maximum) is found and the fluorochrome is excited at that maximum. The absorption spectrum of a typical fluorochrome is illustrated in Figure 1(a) where the relative intensity of absorption is plotted against relative wavelength. A monochromator (a device that allows narrow bands of light wavelengths to pass) is then used to scan the fluorescence emission intensity at successive emission wavelengths. The relative intensity of the fluorescence is measured at the various wavelengths to plot the emission spectrum as illustrated in Figure 1(b). The excitation spectrum of a given fluorochrome is determined in a similar manner. The emission maximum is chosen and only emission light at that emission wavelength is allowed to pass to the detector. Then excitation is induced--by means of a monochromator--at various excitation wavelengths and the intensity of the emitted fluorescence is measured. The result is a graph/curve (illustrated in Figure 1(a)) which depicts the relative fluorescence intensity caused by excitation at the successive excitation wavelengths.
| Interactive Java Tutorial | |||||||||||
|
|||||||||||
Several observations can be made from a typical excitation/emission set of curves or spectra. There is usually an overlap at the higher wavelength end of the excitation spectrum and the lower wavelength end of the emission spectrum. This overlap of excitation and emission intensities/wavelengths (illustrated in Figure 1(c)) must be eliminated, in fluorescence microscopy, by means of appropriate selection of excitation filter, dichromatic beamsplitter (in reflected light fluorescence), and barrier filter. Otherwise, the much brighter excitation light overwhelms the weaker emitted light and significantly diminishes specimen contrast.
When electrons go from the excited state to the ground state (see the section below entitled Molecular Explanation), there is a loss of vibrational energy. As a result, the emission spectrum is shifted to longer wavelengths than the excitation spectrum (wavelength varies inversely to radiation energy). This phenomenon is known as Stokes' Law or Stokes' shift. The greater the Stokes' shift, the easier it is to separate excitation light from emission light. The emission intensity peak is usually lower than the excitation peak; and the emission curve is often a mirror image of the excitation curve, but shifted to longer wavelengths. To achieve maximum fluorescence intensity, the fluorochrome is usually excited at the wavelength at the peak of the excitation curve, and the emission is selected at the peak wavelength (or other wavelengths chosen by the observer) of the emission curve. The selections of excitation wavelengths and emission wavelengths are controlled by appropriate filters. In determining the spectral response of an optical system, technical corrections are required to take into account such factors as glass transmission and detector sensitivity variables for different wavelengths.
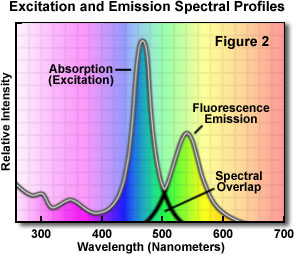
A typical fluorochrome absorption-emission spectral diagram is illustrated in Figure 2. Note that the curves of fluorescence intensity for absorption (usually similar to the excitation curve for pure compounds) and emission for this typical fluorochrome are somewhat similar in shape. The wavelength shift between excitation and emission has been known since the middle of the nineteenth century (Stokes' Law). Also note that the excitation and emission curves overlap somewhat at the upper end of the excitation and the lower wavelengths of the emission curve.
| Interactive Java Tutorial | |||||||||||
|
|||||||||||
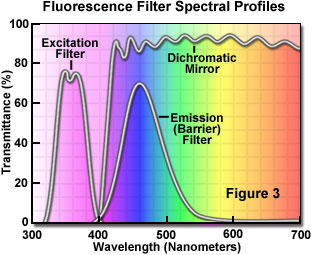
The separation of excitation and emission wavelengths is achieved by the proper selection of filters to block or pass specific wavelengths of the spectrum as shown in Figure 3 below. The design of fluorescence illuminators is based on control of excitation light and emission light by readily changeable filter insertions in the light path on the way toward the specimen and then emanating from the specimen. It is important, in view of low emission intensities, that the light source chosen for excitation be of sufficient brightness so that the relatively weak emission light can be maximized; and that fluorochromes of satisfactory absorption and yield be chosen.
The efficiency with which the fluorochrome absorbs the excitation light is known as the extinction coefficient. The greater the extinction coefficient, the likelier the absorption of light in a given wavelength region (a prerequisite to ensuing fluorescence emission). The yield is referred to as the quantum yield, the ratio of the number of quanta ("packets" of energy) emitted compared to the number of quanta absorbed (usually the yield is between 0.1 and 0.7). Quantum yields below 1 are the result of the loss of energy through non-radiative pathways (e.g. heat or photochemical reaction) rather than the re-radiative pathway of fluorescence. Listed below in Table 1 are fluorescence quantum yields for a group of selected fluorochromes. Notice that some yields are trivial (benzene) while others are very efficient (Fluorescein and Rhodamine-B).
Fluorochrome Fluorescence Quantum Yields
|
||||||||||||||||||||||||||||||
Table 1
Extinction coefficient, quantum yield, mean luminous intensity of the light source, and fluorescence lifetime are all important factors contributing to the intensity and utility of fluorescence emission.
Molecular Explanation - Fluorescence activity is sometimes depicted diagrammatically as shown in Figure 4(a) (termed a Jablonski diagram). Prior to excitation, the electron configuration of the molecule is described as being in the ground state. Upon absorbing the excitation light, usually of short wavelengths, electrons may be raised to a higher energy and vibrational excited state; this may take a trillionth of a second (10 to the minus 12th seconds).
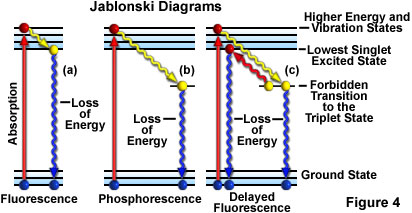
In fluorescence, in an interval of approximately a billionth of a second (10 to the minus 9th seconds), the excited electrons may lose some vibrational energy and return to the so-called lowest excited singlet state. From the lowest excited singlet state, the electrons "drop back" to the ground state with simultaneous emission of fluorescent light as illustrated in Figure 4(a). The emitted light is always of longer wavelengths than the excitation light (Stokes' Law). If the exciting radiation is halted, the fluorescence ceases.
| Interactive Java Tutorial | |||||||||||
|
|||||||||||
If the excited electrons, instead of "dropping back" to the lowest singlet state, make a "forbidden transition" to the triplet state and then to the ground state, the emission of radiation may be considerably delayed�up to several seconds or more. This phenomenon is characteristic of phosphorescence as shown in Figure 4(b). In some instances, the excited electrons may go from the triplet state to the lowest excited singlet state and then return to the ground state, emitting fluorescent light. This action takes a little longer (about a microsecond or two) than usual fluorescence and is called delayed fluorescence (Figure 4(c)). Under some circumstances, e.g. photobleaching or the presence of salts of heavy metals, etc., emitted light may be significantly reduced or halted altogether, as discussed below.
Fading - There are conditions that may affect the re-radiation of light and thus reduce the intensity of fluorescence. This reduction of emission intensity is generally called fading. Some authors further subdivide fading into quenching and bleaching. Bleaching is irreversible decomposition of the fluorescent molecules because of light intensity in the presence of molecular oxygen. Quenching also results in reduced fluorescence intensity and frequently comes about as a result of oxidizing agents or the presence of salts of heavy metals or halogen compounds.
Sometimes quenching results from the transfer of energy to other so-called acceptor molecules physically close to the excited fluorophores, a phenomenon known as resonance energy transfer. This particular phenomenon has become the basis for a newer technique of measuring distances far below the lateral resolution of the light microscope.
The occurrence of bleaching has led to a technique known as FRAP, or Fluorescence Recovery After Photobleaching. FRAP is based upon bleaching by short laser bursts and subsequent observation of the recovery of fluorescence caused by the diffusion of fluorophores into the bleached area.
Properties of Popular Antifade Reagents
|
|||||||||||||||||
Table 2
To lessen fading in some specimens, it may be advisable to use a neutral density filter in the light path before the light reaches the excitation filter, thus diminishing the excitation light intensity. In other instances, fading effects may be reduced by changing the pH of the mounting medium or by using anti-bleaching agents (several of the more important agents are listed in Table 2). For photomicrography or visual observation, rapidly changing the field of view may also avoid fading effects.
Contributing Authors
Mortimer Abramowitz - Olympus America, Inc., Two Corporate Center Drive., Melville, New York, 11747.
Michael W. Davidson - National High Magnetic Field Laboratory, 1800 East Paul Dirac Dr., The Florida State University, Tallahassee, Florida, 32310.
BACK TO FLUORESCENCE MICROSCOPY