Fluorescence Digital Image Gallery
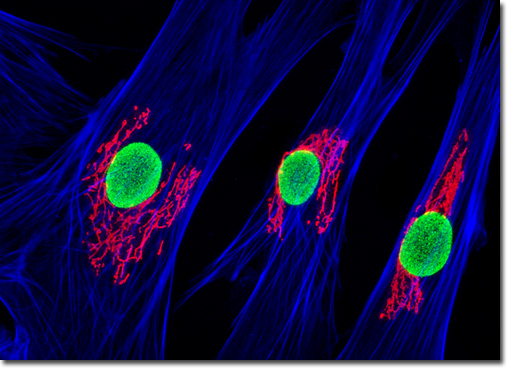
Tahr Ovary Epithelial Cells (HJ1.Ov)
|
Upon arrival at the cis face of the Golgi complex, vesicles from the endoplasmic reticulum fuse with the organelle, merging their membranes as well as the material contained in their lumens. As the substances travel through the cisternae of the Golgi stacks, they generally undergo a number of ordered modifications before they are released from the trans face of the apparatus. Among the most important of these modifications are changes to carbohydrate groups, certain enzymes resident in the Golgi complex modifying the oligosaccharide chains of glycoproteins by detaching various mannose residues and replacing them with other sugars. In addition to modifying preexisting molecules, however, the Golgi complex also manufactures various new macromolecules, such as pectins, on its own. Both the modification and production activities of the organelle occur in stages, products being transferred through the stacked cisternae via vesicles and the groups of enzymes specific to those cisternae acting upon the molecules in turn. Employing a combination of ultraviolet, blue, and green excitation Alexa Fluor (350, 488, and 568, respectively) dyes, the monolayer culture of HJ1.Ov cells illustrated above was triple-labeled using double immunofluorescence and a phallotoxin. Nuclei were visualized with mouse anti-NPCP (nuclear pore complex protein) primary antibodies, while the Golgi complex was stained with rabbit anti-giantin antibodies. Secondary antibodies were goat anti-mouse and anti-rabbit conjugated to Alexa Fluor 488 and 568. The filamentous actin network was counterstained with Alexa Fluor 350 conjugated to phalloidin. Images were recorded in grayscale with a QImaging Retiga Fast-EXi camera system coupled to an Olympus BX-51 microscope equipped with bandpass emission fluorescence filter optical blocks provided by Omega Optical. During the processing stage, individual image channels were pseudocolored with RGB values corresponding to each of the fluorophore emission spectral profiles. |
© 1995-2025 by Michael W. Davidson and The Florida State University. All Rights Reserved. No images, graphics, software, scripts, or applets may be reproduced or used in any manner without permission from the copyright holders. Use of this website means you agree to all of the Legal Terms and Conditions set forth by the owners.
This website is maintained by our
|