Fluorescence Digital Image Gallery
Transformed African Green Monkey Kidney Fibroblast Cells (COS-7)
|
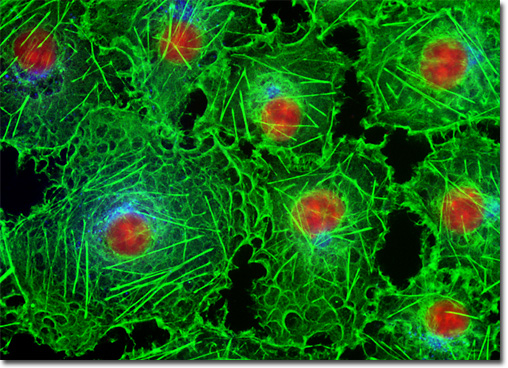
Fluorophores designed to probe the internal environment of living cells have been widely examined by a number of investigators, and many hundreds have been developed to monitor such effects as localized concentrations of alkali and alkaline earth metals, heavy metals (employed biochemically as enzyme cofactors), inorganic ions, thiols and sulfides, nitrite, as well as pH, solvent polarity, and membrane potential. Originally, the experiments in this arena were focused on changes in the wavelength and/or intensity of absorption and emission spectra exhibited by fluorophores upon binding calcium ions in order to measure intracellular flux densities. These probes bind to the target ion with a high degree of specificity to produce the measured response and are often referred to as spectrally sensitive indicators. Ionic concentration changes are determined by the application of optical ratio signal analysis to monitor the association equilibrium between the ion and its host. The concentration values derived from this technique are largely independent of instrumental variations and probe concentration fluctuations due to photobleaching, loading parameters, and cell retention. In the past few years, a number of new agents have been developed that bind specific ions or respond with measurable features to other environmental conditions. The culture of COS-7 cells presented in the digital image above was labeled with Alexa Fluor 350 conjugated to the fluorescent lectin wheat germ agglutinin, which selectively binds to sialic acid residues, primarily in the Golgi apparatus. In addition, the culture was stained for F-actin with Alexa Fluor 488 conjugated to phalloidin, and for nuclear DNA with propidium iodide. Images were recorded in grayscale with a QImaging Retiga Fast-EXi camera system coupled to an Olympus BX-51 microscope equipped with bandpass emission fluorescence filter optical blocks provided by Omega Optical. During the processing stage, individual image channels were pseudocolored with RGB values corresponding to each of the fluorophore emission spectral profiles. |
© 1995-2025 by Michael W. Davidson and The Florida State University. All Rights Reserved. No images, graphics, software, scripts, or applets may be reproduced or used in any manner without permission from the copyright holders. Use of this website means you agree to all of the Legal Terms and Conditions set forth by the owners.
This website is maintained by our
|
