
Contrast in Optical Microscopy
When imaging specimens in the optical microscope, differences in intensity and/or color create image contrast, which allows individual features and details of the specimen to become visible. Contrast is defined as the difference in light intensity between the image and the adjacent background relative to the overall background intensity. In general, a minimum contrast value of 0.02 (2 percent) is needed by the human eye to distinguish differences between the image and its background. For other detectors, such as film, video cameras, or photodetectors (CCD and CMOS devices), the minimum contrast is often a different value. With each detector, the signal-to-noise ratio (noise is all of the light in the optical system devoid of image information) must be large enough to be interpreted in terms of the formation of a coherent image.
Contrast produced in the specimen by the absorption of light, brightness, reflectance, birefringence, light scattering, diffraction, fluorescence, or color variations has been the classical means of imaging specimens in brightfield microscopy. The ability of a detail to stand out against the background or other adjacent details is a measure of specimen contrast. In terms of a simple formula, contrast can be described as :
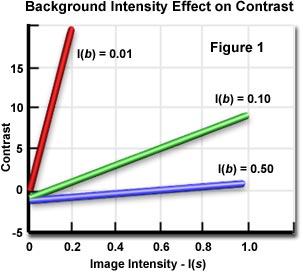
Where I(b) is the intensity of the background and I(s) is the specimen intensity. From this equation, it is evident that specimen contrast refers to the relationship between the highest and lowest intensity in the image. The graph shown in Figure 1 illustrates the effect of background intensity on contrast. When the background is a very dark gray color (I(b) equals 0.01), a small change in image intensity produces a large change in contrast. By lightening the background to a somewhat lighter gray color (I(b) equals 0.10), small changes in image intensity provide a useful range of contrast. At still lighter background colors (I(b) > 0.20), image contrast is relatively insensitive to background intensity and large changes in I(b) produce only small increases or decreases in image contrast.
Although the optical systems found in modern microscopes may be capable of producing high resolution images at high magnifications, such a capability is worthless without sufficient contrast in the image. Contrast is not an inherent property of the specimen, but is dependent upon interaction of the specimen with light and the efficiency of the optical system coupled to its ability to reliably record this image information with the detector. Control of image contrast in a microscope optical system is dependent upon several factors, primarily the setting of aperture diaphragms, degree of aberration in the optical system, the optical contrast system employed, the type of specimen, and the optical detector. There are several sites in the microscope that allow adjustment of contrast. These consist of the field aperture, condenser aperture, additional magnification for video detectors, electronic camera gamma, film gamma, printing paper gamma, image processing in real time, as well as specimen staining.
| Interactive Tutorial | |||||||||||
|
|||||||||||
Because the human eye perceives an object by the contrast generated in its image, one can be easily led astray unless there is knowledge of the optical events that occur to produce contrast in the image. Figure 2 illustrates three photomicrographs of the same viewfield containing transparent, colorless human cheek cells imaged with an optical microscope under differing contrast modes: brightfield, phase contrast, and Hoffman modulation contrast. It is quite apparent that the three images appear different, and because of these variations, a microscopist might arrive at a different conclusion from each viewfield. The cells illustrated in Figure 2(a) were imaged with a microscope operating in brightfield mode with the condenser aperture closed down enough to render the specimen edges visible.
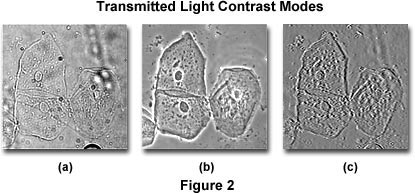
An identical viewfield of the cheek cells using phase contrast optics is shown in Figure 2(b). Note the dark inner areas and the bright outer areas surrounding the edges of objects such as the cell membranes and nuclei (called halos, and are artifacts). In this view, it is difficult to specify the edges of the cells and to interpret the cause of the dark and light areas in the image. The cells also appear quite flat. Finally, the cells illustrated in Figure 2(c) were imaged using Hoffman modulation contrast, where one side of the image is dark while its opposite side is bright, leading to the perception of a pseudo three-dimensional object. Each viewfield in Figure 2 provides a different specimen image and leads to different interpretations, which can only be deciphered with knowledge about how the microscope created these images.
For many specimens in optical microscopy, especially unstained or living material, contrast is so poor that the specimen remains essentially invisible regardless of the ability of the objective to resolve or clearly separate details. Often, for just such specimens, it is important not to alter them by killing or treatment with chemical dyes or fixatives. This necessity has led microscopists to experiment with contrast enhancing techniques for over a hundred years in an attempt to improve specimen visibility and to bring more detail to the image without altering the specimen itself. It is a common practice to reduce the condenser aperture diaphragm below the recommended size or to lower the substage condenser to increase specimen contrast. Unfortunately, while these maneuvers will indeed increase contrast, they also seriously reduce resolution and sharpness.
It is useful to consider the characteristics of how light and matter interact before discussing methods of controlling contrast in the light microscope. Light responsible for illuminating the specimen may be either spatially coherent, incoherent, or partially coherent. For example, the light beam can be shaped in the form of a slit or annulus, and can be composed of selected wavelengths that vibrate in all directions perpendicular to the direction of propagation or in a single direction due to polarization.
Some specimens are considered amplitude objects because they absorb light partially or completely, and can thus be readily observed using conventional brightfield microscopy. Others that are naturally colored or artificially stained with chemical color dyes can also be clearly imaged with the microscope. These stains or natural colors absorb some part of the white light passing through and transmit or reflect other colors. Often, stains are combined to yield contrasting colors, e.g. blue hematoxylin stain for cell nuclei combined with pink eosin for cytoplasm. It is a common practice to utilize stains on specimens that do not readily absorb light, thus rendering such images visible to the eye.
Other specimens do not absorb light and are referred to as phase objects. Because the human eye can only detect intensity and color differences, the phase changes due to objects must be converted to intensity differences. Phase specimens are characterized by several criteria including their shape (typically round or flat), the density of internal light scattering elements, thickness, and unique chemical or electrical structural properties (collectively grouped as refractive index). Thick specimens may be relatively clear and contain only a few light scattering elements, or they may contain many scattering elements that do not pass light and make the specimen effectively opaque to transmitted illumination. These specimens are often termed reflected light specimens.
When considering optical methods to enhance specimen contrast, it is useful to consider various characteristics of a specimen that can be manipulated to create intensity variations of those characteristics to render them visible. A primary question is which characteristic of the object will be transformed into a different intensity under a unique set of circumstances.
Specimen details and edges that have a size approximating the wavelength of imaging light will diffract or scatter light, provided there is a difference in refractive index between the specimen and its surrounding medium (the surround). Refractive index is defined as the ratio of the speed of light through air or a vacuum divided by the speed of light through the object. Because the speed of light through any material is less than the speed of light in a vacuum, the refractive index always exceeds a value of 1.0 for specimens examined with a microscope. In order to resolve small distances between objects and to reproduce their shape with reasonable fidelity, a large angle of diffracted light must be captured by the microscope objective.
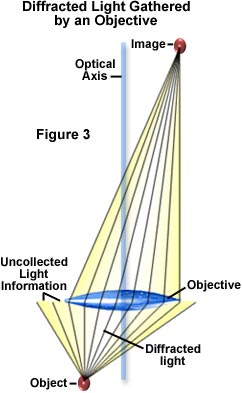
Diffracted (or deviated) light gathered by the objective must be brought into a sharp focus at the image plane in order to generate specimen detail, as illustrated in Figure 3. At the image plane, light waves comprising the diffracted light undergo interference with undiffracted light. The visibility of light after interference is very much dependent upon the coherency of light illuminating the specimen, with visibility increasing proportionally by increasing coherence. In the optical microscope, the condenser aperture diaphragm opening size controls the spatial coherence of light impinging on the specimen. Decreasing the diaphragm opening size yields a greater spatial coherence.
| Interactive Tutorial | |||||||||||
|
|||||||||||
Microscopists have long relied on decreasing the condenser aperture diaphragm opening size to increase visibility of particles and edges in phase specimens. Contrast for amplitude objects can also be improved by proper adjustment of the condenser aperture. Small objects, edges, and particles will diffract light regardless of whether they belong to an amplitude or phase specimen. Only a portion of this diffracted light is captured by the objective (see Figure 3) due to numerical aperture limitations of the objective. Remaining diffracted light that is not collected represents image information that is lost. The correct setting for the condenser aperture diaphragm opening size is a tradeoff between enhancement of specimen image contrast and the introduction of diffraction artifacts. These are manifested in a loss of resolution, superimposition of diffraction rings, and other undesirable optical effects originating from regions in the specimen that are not in common focus. As the diffraction limit is approached, image contrast becomes lower as object details become smaller and spatial frequencies become larger.
Inou� and Spring have described the ratio of image contrast to specimen contrast and the phase shift in positions occupied by the actual and idealized sinusoidal image as the optical transfer function (OTF) when plotted as function of spatial frequency. In cases where the distribution of light from the specimen becomes sinusoidal, the modulus of the optical transfer function becomes the modulation transfer function (MTF). As the spatial frequency increases, the modulation transfer function decreases and specimen contrast is reduced.
For each objective, the specific modulation transfer function is dependent upon the objective design and numerical aperture, the mode of contrast generation, wavelength of illuminating light, and the numerical aperture of the substage condenser. The edge of the objective rear focal plane acts as a low pass filter for the diffracted light, which must be focused at the image plane for interference to occur and form the image of the particle or edge. Focusing a microscope brings these diffracted light waves together at the intermediate image plane. The angle of the light wavefront with respect to the specimen determines the degree of difficulty in focusing on the top or bottom of smooth rounded surfaces, which usually contain no diffraction sites. However, the edges of spherical specimens or fibers are easily focused because the edge interface is at a sufficient angle to the wavefront and diffracts light.
When discussing phase specimens, we will define an object as any resolvable portion of the specimen. Many objects will be flat or plate-like as illustrated in Figure 4. In this figure, the object has a thickness (t) and a refractive index, n(s). The refractive index of the surrounding medium is n(m).
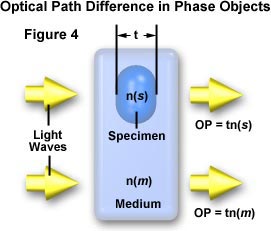
Light travels through the specimen with an optical path, OP = t(n(s)), and through the surrounding media with an optical path, OP = t(n(m)). The optical path difference (OPD) can be expressed as:
With the phase difference being:
where p is a constant (3.14159265) and l is the wavelength of light illuminating the specimen. The optical path difference is the product of two terms: the thickness (t) and the difference in refractive index (n). The OPD can often be quite large even though the thickness of the object is quite thin. On the other hand, when the refractive indices of the specimen and the surrounding medium are equal, the OPD is zero even if the specimen thickness is very large. In this case, light traveling through the object is merely delayed (a phase difference) relative to the light passing an equal thickness of the surround. Phase differences are not detectable by the human eye.
| Interactive Tutorial | |||||||||||
|
|||||||||||
The phase contrast microscope is designed to take advantage of phase differences between objects in a specimen and in the surrounding medium. However, it is not simply a phase difference that is necessary, but also diffraction from the specimen must occur for the phase contrast microscope to work.
The most common shape of a phase object is one of continuously changing optical path or density, such as the hemispherical specimen illustrated in Figure 5. In this instance, the sides of the phase object can be approximated mathematically by a prism shape, as discussed below. The refractive index of the phase object in Figure 5 is designated n(s) and that of the surrounding medium, n(m). Radical geometrical transitions in shape for the phase object occur only at edges A and B (see Figure 5(a)). Incident light impacts the object perpendicular to the plane AB, while the plane wavefront is parallel to AB.
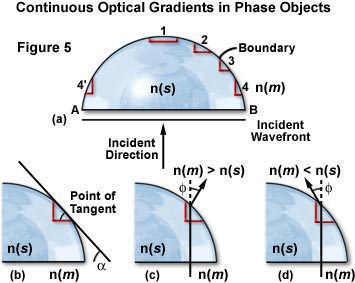
The boundary at 1 (the apex of the rounded phase object in Figure 5(a)) is essentially parallel to the incident wavefront whereas the boundaries at A and B are perpendicular. Regions 2 through 4 are miniature prisms defined by a tangent to the rounded surface of the phase object (Figure 5(b)). The "prism" angle is lesser at region 2 than at region 4, which is opposite to region 4'. At edges A and B diffraction is strongest.
Thus, curved objects are composed of many prisms and opposite sides of the object have prisms oriented in opposite directions. The steepest prisms are at the equator of a spherical object, while prisms with the least slope are located at the top and bottom. These miniature prisms form an optical gradient:
Where a is the angle of the tangent with respect to the plane wavefront. Notice that the optical gradient is the product of two terms: the angle (a) between the sides that the light passes, and the difference in refractive index (n(s) - n(m)). Light that passes through a prism changes direction by the angle f (see Figure 5(c) and 5(d)). The change in direction could be large, even though the slope or boundary gradient may be small, if the difference in refractive index is large. If the refractive indices are identical, the light wave passes through the phase object unrefracted. The direction of light exiting the prism is dependent on the relative difference in refractive indices between the phase object (n(s)) and its surrounding medium (n(m); see Figure 5(c) and 5(d)).
| Interactive Tutorial | |||||||||||
|
|||||||||||
As we have discussed above, rounded phase objects have continuously varying optical gradients, and each individual optical gradient "prism" creates a different angle of light deflection. Figure 5(c) illustrates the direction of deflection when the surrounding medium has a refractive index greater than the phase object (n(m) > n(s)), and Figure 5(d) shows the direction when the opposite is true (n(m) < n(s)). The angle of deflection, f, is proportional to the tangent angle (a) and the difference in refractive index (n(s) - n(m)), such that:
For small angles:
To summarize the "prism" effect of optical gradient boundaries, when the refractive index of the phase object exceeds that of the surrounding medium, gradients of equal size on each slope of the object deflect at the same angle. This deflection angle is dependent upon the relative refractive index difference and the geometric tangent angle (a). When the refractive index of the medium (n(m)) is greater than the refractive index of the object (n(s)), the deflection is opposite from when the situation is reversed. When there is no gradient, there is no deflection of light passing through.
Light can interact with a specimen through a variety of mechanisms to generate image contrast. These include reflection from the surface, absorption, refraction, polarization, fluorescence, and diffraction. Contrast can also be increased by physical modification of the microscope optical components and illumination mode as well as manipulation of the final image through photographic or digital electronic techniques. The following discussion highlights various interactions between the specimen and light and reviews some of the optical microscopy techniques that have been developed to enhance specimen contrast.
When incident illumination strikes an opaque surface, it is reflected in a manner that is specific to the terrain of that surface. Very smooth surfaces reflect light at an angle equaling that of the incident light, a mechanism known as specular reflection. Uneven or diffuse surfaces tend to reflect light at all possible angles by a phenomenon known as diffuse reflection, resulting in a reduced amount of light entering the objective. Contrast in reflected light microscopy can be enhanced by careful specimen preparation. Metallographic samples are often etched with reactive liquids and gases to reveal grain boundaries and/or polished to increase the amount of light reflected into the microscope. Stains, in the form of fluorescent dyes, thin films, and metallic coatings, are also used to introduce contrast in reflected light microscopy specimens. Birefringent specimens can be imaged using polarized reflected light and transparent phase objects are often the subject of observation using techniques such as reflected differential interference contrast, darkfield illumination, and Hoffman modulation contrast.
The human eye is very sensitive to amplitude and wavelength differences in a specimen. For this reason, many specimens are cut into very thin sections (ranging from 1-30 microns in thickness) and stained with chemical dyes to increase contrast and to differentiate between structures residing within the specimen. This technique has been quite commonly used with biological specimens for several hundred years. Dyes selectively absorb light from one or several wavelengths and pass or reflect all other wavelengths. An example is a blue dye that absorbs all visible light wavelengths with the exception of blue, which is reflected from and transmitted through the specimen. Internal structural elements of a biological specimen are often stained with a mixture of dyes to selectively stain these elements, increasing their contrast against a background of material that is either transparent or stained a different color.
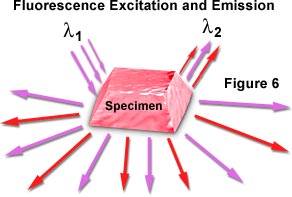
These techniques also apply to fluorescent dyes, which can be used to increase contrast in specimens with a high degree of specificity. When fluorescent specimens are stimulated with one wavelength of visible or near-ultraviolet light, they often emit longer wavelengths of light and thereby become visible or contrasted relative to other objects in the field or the background (Figure 6). The technique of fluorescence microscopy is discussed in detail in another section of the Microscopy Primer.
An early and currently used method of increasing contrast of stained specimens utilizes color contrast filters, Wratten lacquered gelatin squares (from Kodak), or interference filters in the light path. For example, if a specimen is stained with a red stain, a green filter will darken the red areas thus increasing contrast. On the other hand, a green filter will lighten any green stained area. Color filters are very valuable aids to specimen contrast, especially when black and white photomicrography is the goal. Green filters are particularly valuable for use with achromat objectives, which are spherically corrected for green light, and phase contrast objectives, which are designed for manipulation of wavelength assuming the use of green light, because phase specimens are usually transparent and lack inherent color.
Anisotropic materials usually exhibit two or more refractive indices and are thus termed birefringent, or doubly refracting. Among the specimens included in this category are minerals, crystals (which exhibit a high degree of structural symmetry), fibers, hairs, and other biological specimens. When light enters a non-optic (an axis other than the optic axis) axis of anisotropic crystals, it is refracted into two rays each polarized with their vibration directions oriented at right angles to one another, and traveling at different velocities. The resulting light waves are polarized and can interfere when recombined in the microscope analyzer to produce images of birefringent specimens that are highly colored and contain a significant amount of contrast.
Living specimens and other phase objects, which often yield poor images when viewed in brightfield illumination, are made clearly visible by optical rather than chemical means when viewed under phase contrast, Hoffman modulation contrast and differential interference contrast illumination. These techniques require special optical components in the microscope, but will usually produce images of sufficient contrast to reveal important details about specimen structure. A more thorough discussion of these contrast enhancing techniques can be found in our Specialized Microscopy Techniques section.
Another simple technique for contrast improvement involves the selection of a mounting medium with a refractive index substantially different from that of the specimen. For example, diatoms can be mounted in a variety of contrast-enhancing mediums such as air or the commercial medium Styrax. The difference in refractive indices improves the contrast of these colorless objects and renders their outlines and markings more visible. The following sections describe many of the more complex techniques used by present-day microscopists to improve specimen contrast.
Contrast-Enhancing Techniques
|
||||||||||||||||||||||||||||||
Table 1
Table 1 presents a summary of the contrast enhancing technique(s) of choice for a variety of specimens and materials that are studied with both transmitted and reflected light microscopy. This table may be used as a rough guide to approach specific imaging problems in optical microscopy. Additional material concerning contrast enhancement is provided in our Specialized Techniques section of the Molecular Expressions Microscopy Primer.
Contributing Authors
Robert Hoffman - Modulation Optics, Inc., 100 Forest Drive, Greenvale, New York 11548.
Michael W. Davidson - National High Magnetic Field Laboratory, 1800 East Paul Dirac Dr., The Florida State University, Tallahassee, Florida, 32310.
BACK TO SPECIALIZED TECHNIQUES