
Interactive Tutorials
Jablonski Energy Diagram
Fluorescence activity can be schematically illustrated with the classical Jablonski diagram, first proposed by Professor Alexander Jablonski in 1935 to describe absorption and emission of light. Prior to excitation, the electronic configuration of the molecule is described as being in the ground state. Upon absorbing a photon of excitation light, usually of short wavelengths, electrons may be raised to a higher energy and vibrational excited state, a process that may only take a quadrillionth of a second (a time period commonly referred to as a femtosecond, 10E-15 seconds). This tutorial explores how electrons in fluorophores are excited from the ground state into higher electronic energy states and the events that occur as these excited molecules emit photons and fall back into lower energy states.
To operate the tutorial, first select an absorption and emission mechanism (Fluorescence, Phosphorescence, or Delayed fluorescence) by toggling through the choices presented in the pull-down menu. Next, click on the Start button with the mouse to induce a virtual electron to absorb energy and be promoted to a higher energy level. After the electron arrives at the higher energy level, it will then decay in a manner typical of the selected excitation mechanism. The approximate lifetimes of electronic transitions appear in the tutorial window while each transition is occurring.
A typical Jablonski diagram (see Figure 1) illustrates a singlet ground electronic state (the parallel bars labeled S(0)), as well as singlet first (S(1); upper set of parallel bars) and sometimes a second electronic excited state (S(2); not shown in this tutorial). At each energy level, fluorophores can exist in a number of vibrational energy levels, which are represented by the multiple lines in each electronic state. The spacing between energy levels is about 1500 reciprocal centimeters, which exceeds the energy necessary for population of excited vibrational states by thermal energy at room temperature. Transitions between states are depicted by a sphere (representing an electron) followed by a vertical line that traverses the region between the ground and excited state. The electronic transitions are almost instantaneous in nature, often occurring in timeframes ranging from nano to sub-pico seconds, which are far too short to observe significant lateral displacement of nuclei during fluorescence and phosphorescent events.
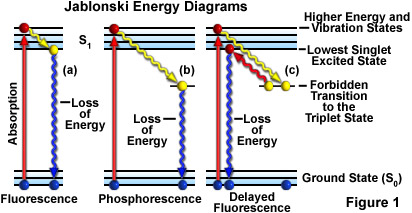
When a fluorophore absorbs light energy, it is usually excited to a higher vibrational energy level in the first excited state (S(1)) before rapidly relaxing to the lowest energy level. This event, depicted in the tutorial as a "stair-step" transition from the upper to lower bars in S(1), is termed vibrational relaxation or internal conversion and occurs in about a picosecond or less. Fluorescence lifetimes are typically four orders of magnitude slower than vibrational relaxation, giving the molecules sufficient time to achieve a thermally equilibrated lowest-energy excited state prior to fluorescence emission.
Phosphorescence decay is similar to fluorescence, except the electron undergoes a spin conversion into a "forbidden" triplet state (T(1)) instead of the lowest singlet excited state, a process known as intersystem crossing. Emission from the triplet state occurs with lower energy relative to fluorescence, hence emitted photons have longer wavelengths. With delayed fluorescence, the electron first decays into the triplet state, and then crosses back over into the lowest singlet excited state before returning to the ground state.
It is interesting to note that the emission spectrum of a fluorophore is typically a mirror image of the S(0) to S(1) absorption spectrum transition. This is due to the fact that electronic excitation does not seriously alter the geometry of the nucleus and the spacing of excited state vibrational levels is similar to that of the ground state. The end result is that fluorescence emission spectra recorded with a spectrophotometer often display similar, but reversed, vibrational structures to those observed in the absorption spectra.
Contributing Authors
Mortimer Abramowitz - Olympus America, Inc., Two Corporate Center Drive., Melville, New York, 11747.
Brian O. Flynn, Matthew J. Parry-Hill, and Michael W. Davidson - National High Magnetic Field Laboratory, 1800 East Paul Dirac Dr., The Florida State University, Tallahassee, Florida, 32310.
BACK TO FLUORESCENCE INTRODUCTION