
Fluorescence Microscopy Interactive Tutorials
Photobleaching
The phenomenon of photobleaching (also commonly referred to as fading) occurs when a fluorophore permanently loses the ability to fluoresce due to photon-induced chemical damage and covalent modification. Upon transition from an excited singlet state to the excited triplet state, fluorophores may interact with another molecule to produce irreversible covalent modifications. The triplet state is relatively long-lived with respect to the singlet state, thus allowing excited molecules a much longer timeframe to undergo chemical reactions with components in the environment. The average number of excitation and emission cycles that occur for a particular fluorophore before photobleaching is dependent upon the molecular structure and the local environment. Some fluorophores bleach quickly after emitting only a few photons, while others that are more robust can undergo thousands or millions of cycles before bleaching. This interactive tutorial explores variations in photobleaching rates in single, dual, and multiply labeled fluorescence specimens.
The tutorial initializes with a pair of identical fluorescence images appearing in the Unbleached Image and Photobleached Image windows. In order to operate the tutorial, click on the Shutter button to open the virtual shutter and allow the Photobleached Image image to fade or photobleach at a greatly exaggerated rate over a fixed time period. Fading can be halted at any point by clicking on the Pause button (which becomes a Start button), and then resumed by clicking on the Start button. In dual and triple labeled specimens, the various individual fluorophore bleaching rates can be viewed individually using the Color Channels check boxes (the default setting is all channels turned on). For example, clicking on the Red check box for a specimen with triple labeling will show only the red color channel. Either two or all three of the color channels can be mixed together in multiply labeled specimens using the Add check box. A new specimen can be selected using the Choose A Specimen pull-down menu. Specimen names include the following fluorophore labeling information: FITC, fluorescein isothiocyanate; Triple, a red, green, and blue fluorophore; Dual, two fluorophores; DAPI, 4',6-diamidino-2-phenylindole; MitoTracker, a mitochondrial probe; Alexa 488, a green fluorophore; and Auto, autofluorescence. The tutorial is designed to randomly alter photobleaching rates for individual fluorophores upon reloading, so that clicking on the Shutter button repeatedly will demonstrate how the image appears as the fluorescence bleaching rate changes for each of the color signals.
Because photobleaching, a very poorly understood phenomenon, leads to a dramatic loss of fluorescence emission intensity in most specimens, controlling the artifact is critical in order to successfully capture satisfactory images. As an example for a typical fluorochrome, the quantum yield for photobleaching of fluorescein at medium to high illumination intensity dictates that an average molecule will emit between 30 to 40 thousand photons during its useful lifetime (before becoming permanently disabled). In addition, the number of excitation and emission cycles is constant for a given fluorophore regardless of how the excitation energy is delivered, either in discrete pulses or through continuous illumination. Therefore, reducing the excitation light level by using neutral density filters does not prevent photobleaching, it merely reduces the rate.
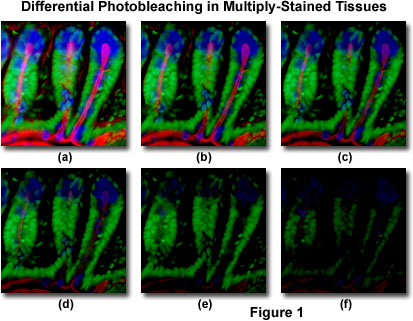
Presented in Figure 1 is a typical example of photobleaching (fading) observed in a series of digital images captured at different time points for a multiply-stained cryostat thin section (16 micrometers) of mouse intestine. The nuclei were stained with Sytox Green (green fluorescence), while the mucus of goblet cells and the filamentous actin in the brush border were stained with Alexa Fluor 350 wheat germ agglutinin (blue fluorescence) and Alexa Fluor 568 phalloidin (red fluorescence), respectively. Time points were taken in two-minute intervals using a fluorescence filter combination with bandwidths tuned to excite the three fluorophores simultaneously while also recording the combined emission signals. Note that all three fluorophores have a relatively high intensity in Figure 1(a), but the Alexa Fluor 350 and 568 (blue and red) intensities start to drop rapidly at two minutes and are almost completely gone at six minutes. The green-stained nuclei are more resistant to photobleaching, but their intensity also drops steadily over the course of the timed sequence (10 minutes). A wide variety of synthetic antifade reagents will significantly reduce the rate of photobleaching.
An important class of photobleaching events are photodynamic, meaning they involve the interaction of the fluorophore with a combination of light and oxygen. Reactions between fluorophores and molecular oxygen permanently destroy fluorescence and yield a free radical singlet oxygen species that can chemically modify other molecules in living cells. The amount of photobleaching due to photodynamic events is a function of the molecular oxygen concentration and the proximal distance between the fluorophore, oxygen molecules, and other cellular components. Photobleaching can be reduced by limiting the exposure time of fluorophores to illumination or by lowering the excitation energy. However, these techniques also reduce the measurable fluorescence signal. In many cases, solutions of fluorophores or cell suspensions can be deoxygenated, but this is not feasible for living cells and tissues. Perhaps the best protection against photobleaching is to limit exposure of the fluorochrome to intense illumination (using neutral density filters) coupled with the judicious use of commercially available antifade reagents that can be added to the mounting solution or cell culture medium.
Under certain circumstances, the photobleaching effect can also be utilized to obtain specific information that would not otherwise be available. For example, in fluorescence recovery after photobleaching (FRAP) experiments, fluorophores within a target region are intentionally bleached with excessive levels of irradiation. As new fluorophore molecules diffuse into the bleached region of the specimen (recovery), the fluorescence emission intensity is monitored to determine the lateral diffusion rates of the target fluorophore. In this manner, the translational mobility of fluorescently labeled molecules can be ascertained within a very small (2 to 5 micrometer) region of a single cell or section of living tissue.
Contributing Authors
Brian Herman - Department of Cellular and Structural Biology, University of Texas Health Science Center, 7703 Floyd Curl Drive, San Antonio, Texas 78229.
Matthew J. Parry-Hill, Ian D. Johnson, and Michael W. Davidson - National High Magnetic Field Laboratory, 1800 East Paul Dirac Dr., The Florida State University, Tallahassee, Florida, 32310.
BACK TO FLUORESCENCE INTRODUCTION
BACK TO FLUORESCENCE MICROSCOPY