
Interactive Java Tutorials
Fluorescence Filter Combination Profiles
Wavelength selection through the application of specialized filter combinations is a critical, but highly complex factor in fluorescence microscopy. The primary filtering elements in a reflected light fluorescence microscope are combined into a set of three filters housed in an optical block, commonly referred to as a fluorescence filter cube or filter block. Each set contains an excitation and emission filter in combination with a dichromatic beamsplitter (often termed a dichroic mirror) to separate excitation illumination from the weak secondary fluorescence emitted by the specimen. This interactive tutorial explores how the combined transmission and reflection profiles of various filter sets can be modified to fit the absorption and emission spectra of common fluorophores.
The tutorial initializes with a graph of wavelength (300 to 700 nanometers) versus filter transmission percentage appearing in the window, and a set of spectra representing a typical ultraviolet excitation fluorescence filter set placed on the graph. The excitation filter profile is outlined by a red curve, whose bandwidth is controlled by the Excitation Profile slider. Above the slider is displayed the center wavelength (CWL) of the filter and the bandpass width at 50 percent of the maximum transmission (referred to as the full width at half maximum, FWHM). Adjacent to the Excitation Profile slider is the Dichromatic Mirror Profile slider (yellow curve), which indicates the wavelength at 50 percent of maximum transmission. At wavelengths below the number indicated by the Dichromatic Mirror Profile slider, light is reflected from the mirror surface, while at longer wavelengths, light is transmitted through the mirror. For all filter sets in the tutorial, the excitation filter is a bandpass filter, while the dichromatic mirror is a longpass filter. The emission filter can have either a bandpass or longpass profile. The transmission properties of all three filters in any given set can be modified with the sliders.
The fluorescence emission filter, which determines the spectral content of light used to form the image, is represented by a white curve that is controlled by the Emission Profile slider. Above the emission filter slider is an indicator for the center wavelength of the filter in bandpass mode, or the cut-on wavelength if the filter has a longpass profile. In addition, the profile (bandpass or longpass and wavelength range) of the emission filter is displayed and constantly updated in the yellow box appearing in the lower right-hand corner of the tutorial window. In order to select another filter set, use the Choose A Filter Set pull-down menu. Filter sets included in the tutorial have excitation filters in the ultraviolet, violet, blue, green, yellow, and red regions of the spectrum.
A typical fluorescence filter block, illustrating the geometrical arrangement of interference filters, is presented schematically in Figure 1. The diagram shows the proper orientation of filters in a block designed to be housed in the epi-illuminator for an upright microscope (the filters would be vertically flipped for an inverted tissue culture microscope). Illumination from the arc-discharge source passes through the excitation filter and is reflected from the surface of the dichromatic mirror towards the specimen at a 90-degree angle. Upon returning from the specimen, fluorescence emission passes through the dichromatic mirror and excitation wavelengths reflected from the specimen are directed back into the illuminator by the mirror. The emission (barrier) filter removes residual excitation wavelengths that manage to pass through the dichromatic mirror. In addition, fluorescence emission due to autofluorescence and fluorophores not targeted by the spectral profile of the filter set are blocked by the emission filter.
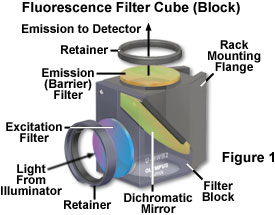
In practice, intense broadband illumination from a mercury, xenon, or tungsten-halogen lamp is channeled into the microscope optical system through the excitation filter, which is chosen to match the absorption spectrum of the fluorescent probe being analyzed. The resulting filtered light is deflected into the rear aperture of the objective by a dichromatic mirror matched to the excitation and emission wavelength spectra. Subsequent emission from the specimen (along with reflected excitation light) is passed through the dichromatic mirror and further filtered by a matched barrier filter. Together, the filters in the set function to eliminate excitation wavelengths, while allowing those emitted by the fluorescent specimen to form a high-contrast image. Seven sequential bandpass and longpass filter combinations can be overlapped to span the entire spectrum from ultraviolet excitation and blue emission to far-red excitation and infrared emission. Table 1 catalogs typical fluorescence filter combinations of excitation filters, dichromatic beamsplitters, and barrier emission filters that are housed in blocks similar to the one illustrated in Figure 1. Most of these filter combinations, or similar variations, can be obtained from the major microscope manufacturers.
Fluorescence Microscopy Filter Combinations
|
||||||||||||||||||||||||||||||||||||||||||
Table 1
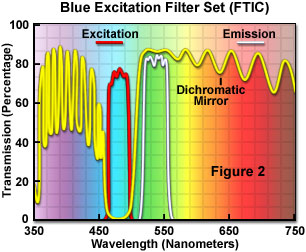
Fluorescence filter combinations designed to be used with a single fluorochrome have the highest possible optical throughput with wavelength profiles tuned to the specific fluorescence absorbance and emission characteristics of the particular target probe. For example, transmission profiles for a typical filter set utilized to image the popular dye fluorescein (FITC) are illustrated in Figure 2. The combination contains a blue bandpass excitation filter having a 30-nanometer passband from 465 to 495 nanometers, and a center wavelength of 480 nanometers. In order to block excitation wavelengths, the blue-reflecting dichromatic mirror has a cut-on wavelength of 510 nanometers (reflecting shorter wavelengths) and acts as a longpass interference filter to transmit longer wavelengths. Finally, the emission or barrier filter is a green bandpass centered at 535 nanometers and has a wavelength range between 515 and 555 nanometers. In situations where greater fluorescence intensity or a wider emission spectrum is required, the emission filter can be substituted with a longpass variety having a cut-on wavelength of about 520 nanometers.
Filter combinations similar to the one illustrated in Figure 2 are available for many common fluorochromes, labeled antibodies, physiological indicators, and expressible genetic markers, such as phytofluors, along with the green fluorescent protein (GFP) and mutant color variants. In general, filter sets pre-loaded into an optical block by the manufacturer are carefully matched and should not be removed or mixed with other filters without a complete understanding of the new spectral characteristics that will prevail.
Contributing Authors
Matthew J. Parry-Hill and Michael W. Davidson - National High Magnetic Field Laboratory, 1800 East Paul Dirac Dr., The Florida State University, Tallahassee, Florida, 32310.
BACK TO FLUORESCENCE MICROSCOPY