
Differential Interference Contrast
Interactive Tutorials
Optical Path Gradients and Amplitude Profiles
The difference in optical path experienced by orthogonal wavefronts passing through a specimen in differential interference contrast (DIC) microscopy is converted by the optical system to a change in amplitude in the final image observed in the eyepieces. This interactive tutorial explores the relationship between optical path gradients and amplitude (intensity) profiles for a variety of semi-transparent specimens.
The tutorial initializes with a randomly chosen specimen image appearing in the left-hand window, and a pair of diagonal blue lines slowly traversing the specimen portion of the image at a 45-degree angle. The shear axis (x) of the Nomarski prisms in the differential interference contrast microscope is indicated by the double-headed white arrow located in the lower corner of the specimen image window (Note: the shear axis of the microscope is parallel to the diagonal lines). As the diagonal blue lines travel across the image, the amplitude profile of the specimen corresponding to a thin diagonal slice between the two blue lines is plotted in the DIC Amplitude Profile window. In addition, the optical path difference (OPD) along the diagonal slice is presented in the Optical Path Difference window.
In order to operate the tutorial manually, first click on the Pause button to halt the motion of the double blue lines. Next, place the mouse cursor on the lines, and then click and drag the lines across the image to view amplitude profiles and optical path difference variations at any slice along the specimen surface. In this manner, variations in amplitude profile and the relationship to the corresponding optical path difference can be examined and compared at each point on the specimen and surrounding background. After a specimen has been thoroughly studied, use the Choose A Specimen pull-down menu to select a new specimen having a different profile. The Applet Speed slider can be utilized to alter the speed at which the blue diagonal lines automatically traverse the specimen image.
After orthogonal wavefronts generated by the beamsplitting prism pass through a specimen phase gradient, they are recombined through differential interference by a second prism and an analyzer (another polarizer) to yield a high-contrast rendition of the gradient. Both differential interference contrast and phase contrast rely on specimen phase differences between sampling and reference beams to produce an image based on varying amplitude. Phase contrast translates image amplitude information from the phase variations exhibited between light waves diffracted by the specimen and a reference beam that passes through the condenser annulus, specimen, and phase plate. In distinction, however, the DIC image corresponds to the mathematical first derivative, rather than the magnitude, of the gradient profile obtained from the specimen optical path difference.
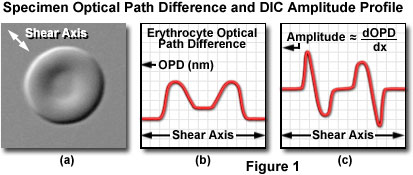
The relationship between optical path gradients and intensity profiles in DIC microscopy is illustrated in Figure 1. The specimen presented in Figure 1(a) is a doughnut-shaped human erythrocyte imaged at high magnification in differential interference contrast with the shear axis indicated by a double-headed arrow (northwest to southeast). A plot of the optical path difference (the ordinate) versus a cross section of the erythrocyte along the shear axis (the abscissa) is shown in Figure 1(b). Note that the optical path profile reflects the thin center and thick edges exhibited by human blood cells. An intensity scan across the differential interference contrast image, which corresponds very closely to the first derivative of the optical path difference curve (Figure 1(b)) when added to a constant, is presented in Figure 1(c). Positive and negative slopes in the erythrocyte optical path profile generate regions of higher and lower amplitude, respectively, in the first derivative scan and corresponding differential interference contrast image. Regions of the optical path difference profile that exhibit no change in slope have the same intensity as the background and correspond to the baseline in the first derivative plot of the optical path difference.
Contributing Authors
Douglas B. Murphy - Department of Cell Biology and Microscope Facility, Johns Hopkins University School of Medicine, 725 N. Wolfe Street, 107 WBSB, Baltimore, Maryland 21205.
Jan Hinsch - Leica Microsystems, Inc., 110 Commerce Drive, Allendale, New Jersey, 07401.
Matthew J. Parry-Hill, Robert T. Sutter, and Michael W. Davidson - National High Magnetic Field Laboratory, 1800 East Paul Dirac Dr., The Florida State University, Tallahassee, Florida, 32310.
BACK TO DIFFERENTIAL INTERFERENCE CONTRAST MICROSCOPY