Deconvolution in Optical Microscopy
Introduction
Deconvolution is a computationally intensive image processing technique that is being increasingly utilized for improving the contrast and resolution of digital images captured in the microscope. The foundations are based upon a suite of methods that are designed to remove or reverse the blurring present in microscope images induced by the limited aperture of the objective.

Nearly any image acquired on a digital fluorescence microscope can be deconvolved, and several new applications are being developed that apply deconvolution techniques to transmitted light images collected under a variety of contrast enhancing strategies. Among the most suitable subjects for improvement by deconvolution are three-dimensional montages constructed from a series of optical sections.
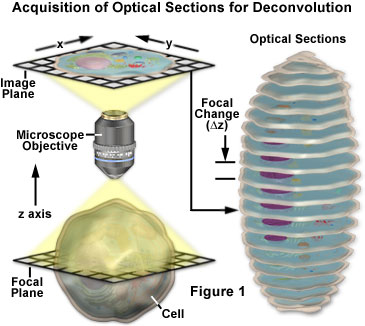
The basic concepts surrounding acquisition of serial optical sections for deconvolution analysis are presented with a schematic diagram in Figure 1. The specimen is an idealized cell from which a series of optical sections (illustrated on the right) are recorded along the z-axis of a generalized optical microscope. For each focal plane in the specimen, a corresponding image plane is recorded by the detector and subsequently stored in a data analysis computer. During deconvolution analysis, the entire series of optical sections is analyzed to create a three-dimensional montage.
As a technique, deconvolution is often suggested as a good alternative to the confocal microscope. This is not strictly true because images acquired using a pinhole aperture in a confocal microscope can also be analyzed by deconvolution techniques. However, a majority of the deconvolution experiments reported in the literature apply to images recorded on a standard widefield fluorescence microscope. Modern deconvolution algorithms have yielded images of comparable resolution to that of a confocal microscope. In fact, confocal microscopy and widefield deconvolution microscopy both work by removing image blur, but do so by opposite mechanisms. Confocal microscopy prevents out-of-focus blur from being detected by placing a pinhole aperture between the objective and the detector, through which only in-focus light rays can pass. In contrast, widefield microscopy allows blurred light to reach the detector (or image sensor), but deconvolution techniques are then applied to the resulting images either to subtract blurred light or to reassign it back to a source. Confocal microscopy is especially well suited for examining thick specimens such as embryos or tissues, while widefield deconvolution microscopy has proven to be a powerful tool for imaging specimens requiring extremely low light levels, such as living cells bearing fluorescently labeled proteins and nucleic acids.
Sources of Image Degradation
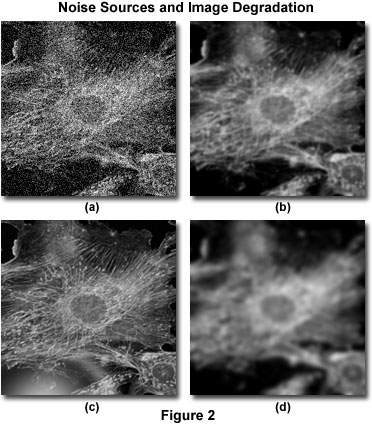
The sources of image degradation can be divided into four independent phenomena: noise, scatter, glare, and blur. Figure 2 presents examples of the visual impact of each of these on the same image. The principal task of deconvolution methods is to remove the out-of-focus blur from images. Deconvolution algorithms can and do remove noise, but this is a relatively simple aspect of their general overall performance.
Noise can be described as a quasi-random disarrangement of detail in an image, which (in its most severe form) has the appearance of white noise or salt-and-pepper noise, similar to what is seen in broadcast television when experiencing bad reception (Figure 2(a)). This type of noise is referred to as "quasi-random" because the statistical distribution can be predicted if the mechanics of the source are known. In digital microscopy, the main source of noise is either the signal itself (often referred to as photon shot noise) or the digital imaging system. The mechanics of both noise sources are understood and therefore, the statistical distribution of noise is known. Signal-dependent noise can be characterized by a Poisson distribution, while noise arising from the imaging system often follows a Gaussian distribution. Because the source and distribution of common noise in digital mages is so well understood, it can be easily removed by application of the appropriate image filters, which are usually included in most deconvolution software packages as an optional "pre-processing" routine.

Scatter is usually referred to as a random disturbance of light induced by passage through regions of heterogeneous refractive index within a specimen. The net effect of scatter is a truly random disarrangement of image detail, as manifested in Figure 2(b). Although no completely satisfactory method has been developed to predict scatter in a given specimen, it has been demonstrated that the degree of scattering is highly dependent upon the specimen thickness and the optical properties of the specimen and surrounding embedding materials. Scatter increases with both specimen thickness and the heterogeneity of the refractive index presented by internal components within a specimen.
Similar to scatter, glare is a random disturbance of light, but occurs in the optical train (lenses, filters, prisms, lens mounts, etc.) of the microscope rather than within the specimen. The level of glare in a modern microscope has been minimized by the employment of lenses and filters with antireflective coatings, and the refinement of lens forming techniques, optical cements, and glass formulations. Figure 2(c) illustrates the effect of uncontrolled glare.
Blur is described by a nonrandom spreading of light that occurs by passage through the imaging system optical train (Figure 2(d)). The most significant source of blur is diffraction, and an image whose resolution is limited only by blur is considered to be diffraction-limited. This represents an intrinsic limit of any imaging system and is the determining factor in assessing the resolution limit of an optical system. Optical theory proposes sophisticated models of blur, which can be applied, with the assistance of modern high-speed computers, to digital images captured in the optical microscope. This is the basis for deconvolution. Because of its fundamental importance in deconvolution, the theoretical model for blur will be discussed in much greater detail in other parts of this section. However, it should be emphasized that all imaging systems produce blur independently of the other forms of image degradation induced by the specimen or accompanying instrumental electronics. It is precisely this independence of optical blur from other types of degradation that enables the possibility of blur removal by deconvolution techniques.
The interaction of light with matter is the primary physical origin of scatter, glare, and blur. However, the composition and arrangement of molecules in a given material (whether it be glass, water, or protein) bestows upon each material its own particular set of optical properties. For the purposes of deconvolution, what distinguish scatter, glare, and blur are the location where they occur and the possibility of generating a mathematical model for these phenomena. Because scatter is a localized, irregular phenomenon occurring in the specimen, it has proven difficult to model. By contrast, because blur is a function of the microscope optical system (principally the objective), it can be modeled with relative simplicity. Such a model renders it possible to reverse the blurring process mathematically, and deconvolution employs this model to reverse or remove blur.
The Point Spread Function
The model for blur that has evolved in theoretical optics is based on the concept of a three-dimensional point spread function (PSF). This concept is of fundamental importance to deconvolution and should be clearly understood in order to avoid imaging artifacts. The point spread function is based on an infinitely small point source of light originating in the specimen (object) space. Because the microscope imaging system collects only a fraction of the light emitted by this point, it cannot focus the light into a perfect three-dimensional image of the point. Instead, the point appears widened and spread into a three-dimensional diffraction pattern. Thus, the point spread function is formally defined as the three-dimensional diffraction pattern generated by an ideal point source of light.

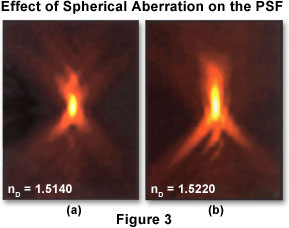
Depending upon the imaging mode being utilized (widefield, confocal, transmitted light), the point spread function has a different and unique shape and contour. In a widefield fluorescence microscope, the shape of the point spread function resembles that of an oblong "football" of light surrounded by a flare of widening rings. To describe the point spread function in three dimensions, it is common to apply a coordinate system of three axes (x, y, and z) where x and y are parallel to the focal plane of the specimen and z is parallel to the optical axis of the microscope. In this case, the point spread function appears as a set of concentric rings in the x-y plane, and resembles an hourglass in the x-z and y-z planes (as illustrated in Figure 3). An x-y slice through the center of the widefield point spread function reveals a set of concentric rings: the so-called Airy disk that is commonly referenced in texts on classical optical microscopy.
Two x-z projections of point spread functions showing different degrees of spherical aberration are presented in Figure 3. The optical axis is parallel to the vertical axis of the image. The point spread function on the left displays minimal spherical aberration, while that on the right shows a significant degree of aberration. Note that the axial asymmetry and widening of the central node along the optical axis in the right hand image leads to degraded axial resolution and blurring of signal. In theory, the size of the point spread function is infinite, and the total summed intensity of light in planes far from focus is equal to the summed intensity at focus. However, light intensity falls off quickly and eventually becomes indistinguishable from noise. In an unaberrated point spread function recorded with a high numerical aperture (1.40) oil immersion objective, light occupying 0.2 square micrometers at the plane of focus is spread over 90 times that area at 1 micrometer above and below focus. The specimen utilized to record these point spread function images was a 0.1 micrometer-diameter fluorescent bead mounted in glycerol (refractive index equal 1.47), with immersion oils having the refractive indices noted in the figure.
An important consideration is how the point spread function affects image formation in the microscope. The theoretical model of image formation treats the point spread function as the basic unit of an image. In other words, the point spread function is to the image what the brick is to the house. The best an image can ever be is an assembly of point spread functions, and increasing the magnification will not change this fact. As a noted theoretical optics textbook (Born and Wolf: Principles of Optics) explains, "It is impossible to bring out detail not present in the primary image by increasing the power of the eyepiece, for each element of the primary image is a small diffraction pattern, and the actual image, as seen by the eyepiece, is only the ensemble of the magnified images of these patterns".
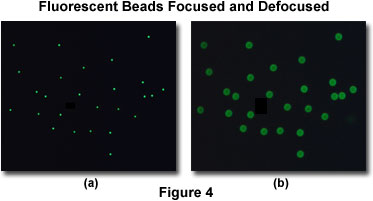
As an example, consider a population of minute fluorescent beads sandwiched between a coverslip and microscope slide. An in-focus image of this specimen reveals a cloud of dots, each of which, when examined at high resolution, is actually a disk surrounded by a tiny set of rings (in effect, an Airy disk; see Figure 4(a)). If this specimen is removed from focus slightly, a larger set of concentric rings will appear where each dot was in the focused image (Figure 4(b)). When a three-dimensional image of this specimen is collected, then a complete point spread function is recorded for each bead. The point spread function describes what happens to each point source of light after it passes through the imaging system.

The blurring process just described is mathematically modeled as a convolution. The convolution operation describes the application of the point spread function to every point in the specimen: light emitted from each point in the object is convolved with the point spread function to produce the final image. Unfortunately, this convolution causes points in the specimen to become blurred regions in the image. The brightness of every point in the image is linearly related by the convolution operation to the fluorescence of each point in the specimen. Because the point spread function is three-dimensional, blurring from the point spread function is an inherently three-dimensional phenomenon. The image from any focal plane contains blurred light from points located in that plane mixed together with blurred light from points originating in other focal planes.
The situation can be summarized with the idea that the image is formed by a convolution of the specimen with the point spread function. Deconvolution reverses this process and attempts to reconstruct the specimen from a blurred image.
Aberrations in the Point-spread Function
The point spread function can be defined either theoretically by utilizing a mathematical model of diffraction, or empirically by acquiring a three-dimensional image of a fluorescent bead (see Figure 3). A theoretical point spread function generally has axial and radial symmetry. In effect, the point spread function is symmetric above and below the x-y plane (axial symmetry) and rotationally about the z-axis (radial symmetry). An empirical point spread function can deviate significantly from perfect symmetry (as presented in Figure 3). This deviation, more commonly referred to as aberration, is produced by irregularities or misalignments in any component of the imaging system optical train, especially the objective, but can also occur with other components such as mirrors, beamsplitters, tube lenses, filters, diaphragms, and apertures. The higher the quality of the optical components and the better the microscope alignment, the closer the empirical point spread function comes to its ideal symmetrical shape. Both confocal and deconvolution microscopy depend on the point spread function being as close to the ideal case as possible.
The most common aberration encountered in optical microscopy, well known to any experienced and professional microscopist, is spherical aberration. The manifestation of this aberration is an axial asymmetry in the shape of the point spread function, with a corresponding increase in size, particularly along the z-axis (Figure 3). The result is a considerable loss of resolution and signal intensity. In practice, the most common origin of spherical aberration is a mismatch between the refractive indices of the objective front lens immersion medium and the mounting medium in which the specimen is bathed. A tremendous emphasis should be placed on the importance of minimizing this omnipresent aberration. Although deconvolution can partially restore lost resolution, no amount of image processing can restore lost signal.
Contributing Authors
Wes Wallace - Department of Neuroscience, Brown University, Providence, Rhode Island 02912.
Lutz H. Schaefer - Advanced Imaging Methodology Consultation, Kitchener, Ontario, Canada.
Jason R. Swedlow - Division of Gene Regulation and Expression, School of Life Sciences Research, University of Dundee, Dundee, DD1 EH5 Scotland.
Part 2: Algorithms for Deconvolution Microscopy
BACK TO DECONVOLUTION IN OPTICAL MICROSCOPY
