Ernst Abbe
(1840-1905)
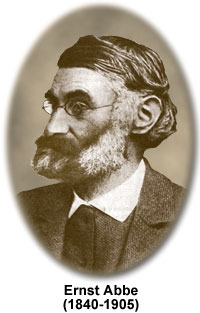
Ernst Abbe was a brilliant German mathematician and physicist who made several of the most important contributions to the design of lenses for optical microscopy. As a young boy, Abbe lived in an impoverished family where his father labored 16 hours a day to provide for his wife and children. Abbe worked his way through school by earning scholarships and with the help of his father's employer.
Abbe studied physics and mathematics as an undergraduate at the University of Jena and went to graduate school at the University of Göttingen, where he received a doctorate in thermodynamics. In 1863 Abbe joined the faculty at the University of Jena where he taught physics. He met Carl Zeiss in 1866 and became very interested in the optical problems surrounding mid-nineteenth century microscopy.
Together with Zeiss, Abbe formed a partnership and he was made the research director of Zeiss Optical Works late in 1866. For the next six years, Zeiss and Abbe worked intensively to lay the scientific foundations for the design and fabrication of advanced optical systems. In 1869, they introduced a new "illumination apparatus" that was designed to improve the performance of microscope illumination. Three years later, in 1872, Abbe formulated his wave theory of microscopic imaging and defined what would become known as the "Abbe Sine Condition". Several years later, Zeiss began to offer a lineup of 17 microscope objectives designed on the basis of Abbe's theoretical calculations. In his own words Abbe stated:
"Based on a precise study of the materials used, the designs concerned are specified by computation to the last detail - every curvature, every thickness, every aperture of a lens - so that any trial and error approach is excluded."
These lenses were the first ever to have been designed based on sound optical theory and the laws of physics. The high quality of Zeiss objectives commanded a new respect and earned Zeiss a worldwide reputation for quality and innovation.
Several problems remained however, because the quality of optical glass produced during the period was not sufficient to provide the theoretical resolution that was dictated by Abbe's sine condition. The glass used in construction of microscope lenses was not homogeneous and tended to undergo a phase separation during cooling. This led to varying refractive index throughout the glass, and light waves passing through lenses made of this glass were bent erratically. Good resolution was unattainable. Abbe turned to several ideas published by Swiss watchmaker Pierre Louis Guinaud, who several years earlier had developed a method of stirring the melted glass to increase the uniformity of the mixture.
Even with this improvement, Abbe remained unconvinced that he had reached the highest stage of performance from the optical glass. He met Otto Schott in 1881, who was a glass chemist with a doctorate in Physics from the University of Jena. Over the next several years, Abbe and Schott developed several new glass formulas and made adjustments to the mixing and annealing process to eliminate internal defects and produce optical-grade glass having a uniform refractive index. In 1884, Schott, Abbe, and Zeiss formed a new company known as Schott and Sons in Jena, Germany. Continued experimentation with glass recipes and preparation techniques yielded good results and in 1886, they introduced a new type of objective, the apochromat.
Apochromat objectives were the most precise and highest performance microscope lenses ever built. They eliminated chromatic aberration and brought the resolving power of the microscope to the limit that it enjoys today. As Abbe had calculated, no amount of glass refinement or theoretical calculation about lens shape could escape the limit of resolution for visible light, which is about one-half micron.
Abbe's good friend Carl Zeiss died on December 3, 1888, and he took this as a grievous loss. In 1889, Abbe established the Carl Zeiss Foundation in memory of his lost friend, and in 1891 transferred his shares in the Optical Workshop and the Schott Glassworks to the new foundation. Abbe took control of the Zeiss Optical Works and introduced some innovative ideas to help improve working conditions for the employees. These ideas were many years ahead of their time, but are now commonplace today. They included an eight-hour working day, paid holidays, sick pay, and pensions.
Ernst Abbe's Major Contributions
Abbe Diffraction Apparatus - A kit of special parts used to demonstrate Abbe's Theory of Image Formation. The kit consists of a slide carrying several diffraction gratings (objective stops), an objective of suitable numerical aperture, and a device enabling slits or diaphragms, to be inserted into the back focal plane of the objective in order to control which parts of the diffraction pattern are allowed to contribute to the image.
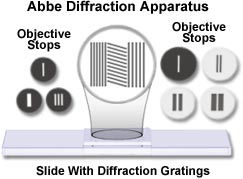
The principal Abbe Diffraction Apparatus components are illustrated in the figure presented above. Objective stops are designed to control the amount of light passing through the microscope. The smaller stops on the left transmit only the central beam (smallest single slit) or the central beam and half of the first-order spectra (largest single slit). The stop having three slits is designed to transmit the central beam and the second-order spectra only. The larger stops (on the right-hand side of the drawing) are designed for diffraction experiments with a 10x achromatic objective. An inexpensive kit, the equipment was proposed by Ernst Abbe in 1876 and manufactured for many years by the Carl Zeiss Company for their 6x achromatic objective having a numerical aperture of 0.17. The 10x objective stops are an aftermarket product designed to be used with the more widely available higher magnification lenses.
| Interactive Java Tutorial | |||||||||||
|
|||||||||||
Abbe Limit - Ernst Abbe's specification for the limit of resolution of a diffraction-limited microscope. According to Abbe, a detail with a particular spacing in the specimen is resolved when the numerical aperture (NA) of the objective lens is large enough to capture the first-order diffraction pattern produced by the detail at the wavelength employed.
In order to fulfill Abbe's requirements, the angular aperture of the objective must be large enough to admit both the zeroth and first order light waves. Because the angular aperture (a) is equal to the arcsine of the wavelength (l) divided by the resolution (R), the finest spatial frequency that can be resolved equals:
where
n • sin(a) = Numerical Aperture
In the numerical aperture equation, n is the refractive index of the imaging medium (usually air, oil, glycerin, or water). Ernst Abbe demonstrated that in order for a diffraction grating image to be resolved, at least two diffraction orders (usually the zeroth and the first) must be captured by the objective and focused at the rear focal plane. As the numerical aperture increases, additional higher-order rays are included in the diffraction pattern, and the integrity of the specimen (line grating) becomes clearer. When only the zeroth and first orders are captured, the specimen is barely resolved, having only a sinusoidal intensity distribution within the image.
Abbe Number (or V Number) - The value (often symbolized by the Greek letter n or the letter V) expressing the dispersion of an optical medium, which is directly proportional to the chromatic quality of a lens. Its value is given by the expression:
Where n(d), n(F) and n(c) are the refractive indices pertaining to the wavelengths of the Fraunhofer lines 587.6, 486.1, and 656.3 nanometers respectively. The Abbe number of a glass mixture is carefully monitored and controlled by manufacturers to achieve target dispersion values, which usually range between 20 and 60. A typical plot of Abbe number versus refractive index is presented in the figure below. The glass map is subdivided into regions that represent various types of glass.
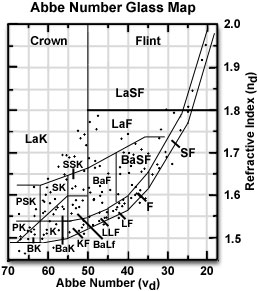
There are over 250 glass formulations that have differing refractive index and Abbe numbers, many of which are represented by points in the glass map illustrated above. Refractive indices range between 1.46 and 1.97 and have corresponding V-numbers from 20 to 85 (although the glass map illustrated above ends at V = 70). Utilizing glass maps, optical designers can locate the closest match to a glass made by another company or determine the range of V-number formulations available for a particular refractive index.
Only a fraction of the large number of known glasses are employed in optical design on a routine basis, with about 50 glass formulations being useful based on cost, ease of optical fabrication, thermal stability, and uniqueness. In the sub regions of the glass map, individual formulations have designations that end in K (referring to a crown glass) or F (flint glass). The border between crown and flint glasses (at V = 50) for the entire refractive index spectrum has been included in the glass map above. Another important boundary in the map extends from the low refractive index and high V-numbers on the lower left to high refractive index, low V-number formulations on the upper right. When all available glass formulations are included on the map, about one third cluster around this boundary.
Abbe Test Plate - A device for testing the chromatic and spherical aberration of microscope objectives. When testing for spherical aberration, the cover glass thickness for which the objective is best corrected is also found. The test plate consists of a slide on which is deposited an opaque metal layer in the form of parallel strips arranged in groups of different widths. The edges of these strips are irregularly serrated to allow the aberrations to be judged more easily. The slide is covered with a wedge-shaped cover glass, whose increasing thickness is marked on the slide.
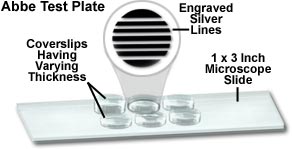
Presented in the figure above is an illustration of a typical Abbe test plate used to test for spherical aberration in microscope objectives. The plate is constructed with multiple coverslips (an alternative to the wedge-shaped cover glass) having a thickness range varying between 0.09 and 0.24 millimeters (greatly exaggerated in the drawing), each covering a series of straight lines engraved through a silver coating leaving alternating clear and opaque areas. A practical application of the test plate is to determine the optimum coverslip thickness for a given objective, and to ascertain the degree of image deterioration due to thickness variations. The plate can also be employed to calibrate the amount of tube length adjustment that must be made to compensate for deviations in coverslip thickness in older microscopes.
Abbe Theory (of Image Formation) - An explanation of the mechanism by which the microscope image is formed. It is based on the necessity for the light rays diffracted by the specimen to be collected by the objective and allowed to contribute to the image; if these diffracted rays are not included, the fine details which give rise to them cannot be resolved.
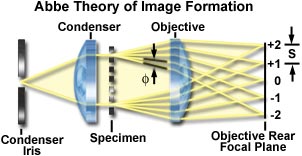
Ernst Abbe demonstrated that if a grating is employed for a specimen and its conoscopic image is examined at the rear aperture of the objective lens with the condenser aperture closed to a minimum, an orderly series of images of the condenser iris opening is observed. These images are arranged in a row at right angles to the periodic line grating. For gratings with broad spacings, several condenser iris images appear within the aperture of the objective lens, perhaps overlapping each other depending on the side of the iris diaphragm opening. Gratings having narrowing spacings display a greater degree of separation between the iris diaphragm images, and fewer become visible. Thus, there is a reciprocal relationship between the line spacings in the specimen and the separation of the conoscopic image at the aperture plane. What is actually observed is the diffraction pattern from the specimen, or the image of the condenser iris diffracted by the periodic spacing of the line grating.
The figure presented above illustrates a schematic drawing of a microscope optical system consisting of a condenser iris diaphragm, condenser, and objective with a periodic grating representing the specimen. The periodic specimen diffracts a collimated beam (arising from each point of the condenser aperture), giving rise to first-order, second-order, and higher order diffracted rays on both sides of the undeviated zeroth-order beam. The diffracted rays occur by constructive interference at a specific angle (f). Each diffracted-order ray (including the zeroth) is focused at the rear focal plane of the objective. The period (s) between the focused diffraction orders is proportional to the numerical aperture of the ray entering the objective. The situation is governed by the equation:
Where f is the focal length of the aberration-free objective that fulfills the sine condition, l is the wavelength of light in the specimen plane, and f is the angle between the lens axis and the diffracted wave.
The most surprising fact about Abbe's experiments is that when the first-order diffraction pattern is masked at the objective rear aperture, so that only the zero- and second-order diffraction patterns are transmitted, the image of the specimen appears with twice the spatial frequency, or with only half the spacing between the lines. In the absence of what is really the first-order diffraction pattern, the image is now generated by interference between the zero- and second-order diffraction patterns, the latter of which is masquerading as the first-order pattern. The observation proves that the waves making up the diffraction pattern at the aperture plane converge and interfere with each other in the image plane and generate the orthoscopic image.
