Organization of the Transition State
|
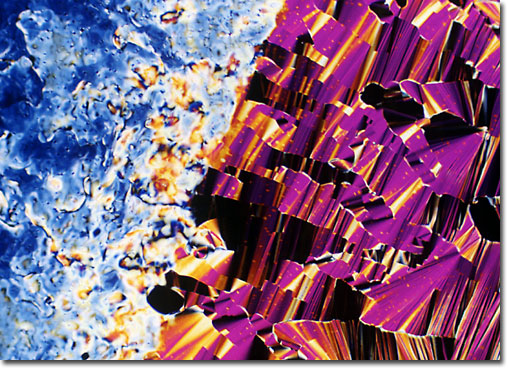
Structure of the transition region between cholesteric and high density liquid crystalline DNA phases has not yet been fully elucidated. The photomicrograph presented above illustrates this birefringent region, but yields few clues to the exact nature of the organization. The DNA concentration in this experiment is approximately 350 milligrams per milliliter, and the photomicrograph magnification is approximately 500x. Originally recorded on Fujichrome 64T transparency film using a Nikon Optiphot-Pol microscope with crossed polarized illumination, the image was digitized using a Nikon CoolScan transparency film scanner. Exposures were recorded about 3 f-steps under the recommended value given by an in-camera photomultiplier and were push-processed approximately 1.75 f-steps in the first E-6 developer. |
© 1995-2025 by Michael W. Davidson and The Florida State University. All Rights Reserved. No images, graphics, software, scripts, or applets may be reproduced or used in any manner without permission from the copyright holders. Use of this website means you agree to all of the Legal Terms and Conditions set forth by the owners.
This website is maintained by our
|