Fluorescence Digital Image Gallery
Male Rat Kangaroo Kidney Epithelial Cells (PtK2)
|
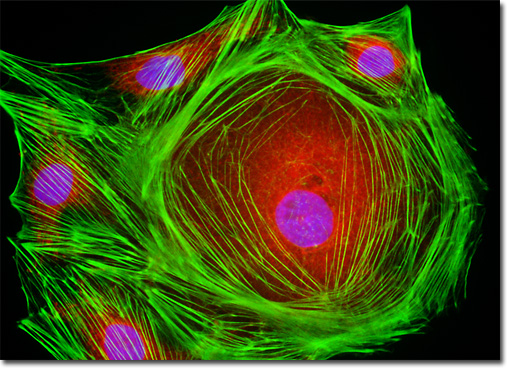
Fluorophores are catalogued and described according to their absorption and fluorescence properties, including the spectral profiles, wavelengths of maximum absorbance and emission, and the fluorescence intensity of the emitted light. One of the most useful quantitative parameters for characterizing absorption spectra is the molar extinction coefficient (denoted with the Greek symbol e), which is a direct measure of the ability of a molecule to absorb light. The extinction coefficient is useful for converting units of absorbance into units of molar concentration, and is determined by measuring the absorbance at a reference wavelength (usually the maximum, characteristic of the absorbing species) for a molar concentration in a defined optical path length. The quantum yield of a fluorochrome or fluorophore represents a quantitative measure of fluorescence emission efficiency, and is expressed as the ratio of the number of photons emitted to the number of photons absorbed. In other words, the quantum yield represents the probability that a given excited fluorochrome will produce an emitted (fluorescence) photon. Quantum yields typically range between a value of 0 and 1, and fluorescent molecules commonly employed as probes in microscopy have quantum yields ranging from very low (0.05 or less) to almost unity. In general, a high quantum yield is desirable in most imaging applications. The quantum yield of a given fluorophore varies, sometimes to large extremes, with environmental factors, such as metallic ion concentration, pH, and solvent polarity. The PtK2 cells presented in the digital image above were resident in a culture fluorescently labeled with Texas Red conjugated to the enzyme DNase I, Alexa Fluor 488 conjugated to phalloidin, and DAPI, targeting globular (unpolymerized) actin, the filamentous F-actin network, and nuclei, respectively. Images were recorded in grayscale with a QImaging Retiga Fast-EXi camera system coupled to an Olympus BX-51 microscope equipped with bandpass emission fluorescence filter optical blocks provided by Omega Optical. During the processing stage, individual image channels were pseudocolored with RGB values corresponding to each of the fluorophore emission spectral profiles. |
© 1995-2025 by Michael W. Davidson and The Florida State University. All Rights Reserved. No images, graphics, software, scripts, or applets may be reproduced or used in any manner without permission from the copyright holders. Use of this website means you agree to all of the Legal Terms and Conditions set forth by the owners.
This website is maintained by our
|