
Fluorescence Microscopy Interactive Java Tutorials
Solvent Effects on Fluorescence Emission
A variety of environmental factors affect fluorescence emission, including interactions between the fluorophore and surrounding solvent molecules (dictated by solvent polarity), other dissolved inorganic and organic compounds, temperature, pH, and the localized concentration of the fluorescent species. The effects of these parameters vary widely from one fluorophore to another, but the absorption and emission spectra, as well as quantum yields, can be heavily influenced by environmental variables. In fact, the high degree of sensitivity in fluorescence is primarily due to interactions that occur in the local environment during the excited state lifetime. This interactive tutorial explores relaxation effects and associated spectral shifts that occur as a function of solvent polarity.
The tutorial initializes with a Jablonski energy diagram appearing in the left-hand portion of the window, and a hypothetical fluorophore bounded by a pair of solvent molecules positioned above a spectral plot of relative fluorescence absorption and emission intensity versus wavelength. Dipole moments for the fluorophore and solvent molecules are indicated by yellow arrows that are superimposed over the ellipsoidal molecules. The length of the solvent dipole arrow indicates the relative degree of polar character (longer arrows represent more polar solvents). The default setting is a non-polar solvent with no dipole moment. In order to operate the tutorial, click on the Start button to initiate an excitation and emission sequence that results in excitation of the molecule to the Franck-Condon excited state, followed by solvent relaxation and a shift of the emission spectrum to longer wavelengths, depending upon the solvent polarity. The degree of solvent polarity can be altered using the Solvent Polarity slider (between an arbitrary range of low and high). Note that increasing the solvent polarity lowers the solvent-relaxed S(1) energy level and increases solvent re-orientation with respect to the fluorophore dipole in the excited state. The relative speed of events in the tutorial can be controlled with the Tutorial Speed slider.
In solution, solvent molecules surrounding the ground state fluorophore have dipole moments that can interact with the dipole moment of the fluorophore to yield an ordered distribution of solvent molecules around the fluorophore. Energy level differences between the ground and excited states in the fluorophore produce a change in the molecular dipole moment, which ultimately induces a rearrangement of surrounding solvent molecules. However, the Franck-Condon principle dictates that, upon excitation of a fluorophore, the molecule is excited to a higher electronic energy level in a far shorter timeframe than it takes for the fluorophore and solvent molecules to re-orient themselves within the solvent-solute interactive environment. As a result, there is a time delay between the excitation event and the re-ordering of solvent molecules around the solvated fluorophore (as illustrated in Figure 1), which generally has a much larger dipole moment in the excited state than in the ground state.
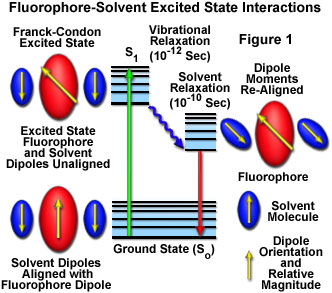
After the fluorophore has been excited to higher vibrational levels of the first excited singlet state (S(1)), excess vibrational energy is rapidly lost to surrounding solvent molecules as the fluorophore slowly relaxes to the lowest vibrational energy level (occurring in the picosecond time scale). Solvent molecules assist in stabilizing and further lowering the energy level of the excited state by re-orienting (termed solvent relaxation) around the excited fluorophore in a slower process that requires between 10 and 100 picoseconds. This has the effect of reducing the energy separation between the ground and excited states, which results in a red shift (to longer wavelengths) of the fluorescence emission. Increasing the solvent polarity produces a correspondingly larger reduction in the energy level of the excited state, while decreasing the solvent polarity reduces the solvent effect on the excited state energy level. The polarity of the fluorophore also determines the sensitivity of the excited state to solvent effects. Polar and charged fluorophores exhibit a far stronger effect than non-polar fluorophores.
Solvent relaxation effects on fluorescence can result in a dramatic effect on the size of Stokes shifts. For example, the heterocyclic indole moiety of the amino acid tryptophan normally resides on the hydrophobic interior of proteins where the relative polarity of the surrounding medium is low. Upon denaturation of a typical host protein with heat or a chemical agent, the environment of the tryptophan residue is changed from non-polar to highly polar as the indole ring emerges into the surrounding aqueous solution. Fluorescence emission is increased in wavelength from approximately 330 to 365 nanometers, a 35-nanometer shift due to solvent effects. Thus, the emission spectra of both intrinsic and extrinsic fluorescent probes can be employed to probe solvent polarity effects, molecular associations, and complex formation with polar and non-polar small molecules and macromolecules.
Quantitative fluorescence investigations should be constantly monitored to scan for potential shifts in emission profiles, even when they are not intended nor expected. In simple systems where a homogeneous concentration can be established, a progressive emission intensity increase should be observed as a function of increasing fluorophore concentration, and vice versa. However, in complex biological systems, fluorescent probe concentration may vary locally over a wide range, and intensity fluctuations or spectral shifts are often the result of changes in pH, calcium ion concentration, energy transfer, or the presence of a quenching agent rather than fluorophore stoichiometry. The possibility of unexpected solvent or other environmental effects should always be considered in evaluating the results of experimental procedures.
Contributing Authors
Brian Herman - Department of Cellular and Structural Biology, University of Texas Health Science Center, 7703 Floyd Curl Drive, San Antonio, Texas 78229.
Joseph R. Lakowicz - Center for Fluorescence Spectroscopy, Department of Biochemistry and Molecular Biology, University of Maryland and University of Maryland Biotechnology Institute (UMBI), 725 West Lombard Street, Baltimore, Maryland 21201.
Ian D. Johnson and Michael W. Davidson - National High Magnetic Field Laboratory, 1800 East Paul Dirac Dr., The Florida State University, Tallahassee, Florida, 32310.
BACK TO FLUORESCENCE INTRODUCTION
BACK TO FLUORESCENCE MICROSCOPY