
Image Formation
Interactive Java Tutorials
Periodic Diffraction Images
When a microscope objective forms a diffraction-limited image of an object, it produces a three-dimensional diffraction pattern that is periodic both along the optical axis (the z-axis) and laterally (the x- and y-axes) in the intermediate image plane. This tutorial explores diffraction images produced by a periodic object at several focal depths.
The periodic object used in the tutorial is a Siemens test star composed of a series of radial black and white lines whose spacing and thickness increases proportionately with the radius. The Degree of Focus slider is used to transition the test star image through a sequential series of different focal levels. As the slider is moved to the right, the test star target slowly loses focus until a substantial loss in contrast and resolution is observed. At the highest out-of-focus levels, the test star undergoes several contrast inversions.
By moving the Degree of Focus slider gradually to the right, finer spacings in the test star are no longer resolved and the contours of the image become rounded. These changes occur when higher spatial frequency components of the image are lost and the diffraction images of closely spaced lines become visually unresolvable. At this focus level, a reversal of contrast is observed in the black and white lines that occur in the intermediate line spacings or spatial frequency range. This is the result of a 180-degree phase shift in image brightness and location, which is brought about by the same interference phenomena that give rise to the periodic reversal of contrast of the central spot in the diffraction image of a point source of light when shifted away from focus (see the interactive Java tutorial linked below).
| Interactive Java Tutorial | |||||||||||
|
|||||||||||
As the image is defocused to a greater degree, resolution continues to drop, with the regions exhibiting contrast reversal growing outward from the center of the test star target. When the slider is moved farther to the right-hand position, test star regions with much larger spacings (lower spatial frequency) near the periphery begin to undergo contrast inversion. At this point, a new region exhibiting contrast reversal appears between the black and white lines at the higher spatial frequencies (thinner spacings). At the highest degree of defocus (when the slider is postioned to the far right), two adjacent contrast inversions are evident in the tutorial window.
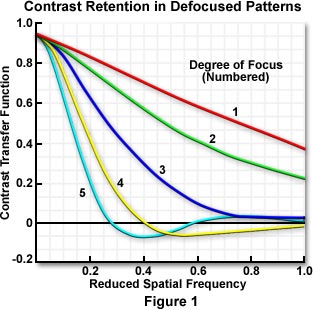
The relationship between spatial frequency and the contrast transfer function (the ratio of contrast of the image to that of the specimen; abbreviated CTF) for a test target composed of alternating black and white stripes is illustrated in Figure 1. The graph represents a series of varying focus levels where the measured CTF is plotted against spatial frequency (number of line pairs per unit distance). A drop in contrast with increased spatial frequency is obvious in the figure, as well as the contrast reversal at focus levels 4 and 5 where the reduced spatial frequency drops into negative values of the CTF. Curve number 1 represents the test target in focus, and curves 2 through 5 present the results with successively increasing levels of defocus. Contrast is reversed where curves 4 and 5 dip below zero on the y-axis.
Contributing Authors
Kenneth R. Spring - Scientific Consultant, Lusby, Maryland, 20657.
Mortimer Abramowitz - Olympus America Inc., Two Corporate Center Drive, Melville, New York 11747.
Brian O. Flynn and Michael W. Davidson - National High Magnetic Field Laboratory, 1800 East Paul Dirac Dr., The Florida State University, Tallahassee, Florida, 32310.
BACK TO MODULATION TRANSFER FUNCTION