
Differential Interference Contrast
Interactive Tutorials
Specimen Orientation Effects on DIC Images
In differential interference contrast (DIC) images, shadow and highlight intensity (amplitude) is greatest along the shear axis of the microscope, and regions of constant refractive index display intensity values that are identical to that of the background. This interactive tutorial explores how image amplitude fluctuates as the specimen orientation is varied with respect to the microscope shear axis.
The tutorial initializes with a randomly chosen specimen appearing in the virtual DIC microscope viewport, where the shear axis is oriented at a 45-degree angle (from the upper left to the lower right of the field) with respect to the browser window. In order to operate the tutorial, use the mouse cursor to translate the Specimen Orientation slider over a 360-degree range. As the specimen is rotated, azimuthal effects will be observed in specimen amplitude, with light areas growing darker and vice versa. In many cases (especially with highly asymmetric and elongated specimens), overall image contrast will fluctuate as a function of specimen orientation, and some features may become indistinguishable from the background. In order to select a new specimen, use the Choose A Specimen pull-down menu.
Each specimen examined in differential interference contrast microscopy will have an optimum bias retardation setting that generates a maximum level of contrast in the final image. Very thin specimens that display a shallow refractive index gradient, such as living cells in culture, generally benefit from equally low bias settings only slightly larger than the largest phase shift present in the specimen (on the order of approximately one-twentieth of a wavelength, or 30 nanometers). However, thicker specimens often require higher bias settings (up to 90 degrees) at large condenser apertures to produce satisfactory results, usually through optical sectioning. Because many specimens are composed of features displaying a variety of different sizes and refractive indices, the optimum bias retardation setting is usually a compromise.
Azimuthal effects of orientation phenomena in differential interference contrast for several specimens are presented in Figure 1. In all cases, the shear axis is directed northwest to southeast (similar to the orientation in the tutorial viewport), but is not indicated on the individual digital images. Figure 1(a) and 1(b) illustrate the periodic spacing of pores and striae exhibited by a mounted frustule from the diatom Gyrosigma attenuatum. When the long axis of the frustule is oriented perpendicular to the shear axis (Figure 1(a)), the pores appear to merge into a series of closely spaced ridges and are not resolved individually. In contrast, reorientation of the frustule in a direction parallel to the shear axis reveals the knob-like geometry of pore structure in this species.
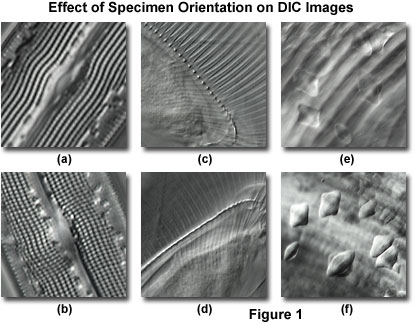
The thorax region containing gill ribs of a freshwater Daphnia (water flea) is presented in Figure 1(c). In this orientation, individual rib structures are clearly visible (perpendicular to the shear axis) and joined to a common spine, which appears as a long series of knobs parallel to the shear axis. When the specimen is rotated 90-degrees (Figure 1(d)), much of the rib structure loses contrast, and the spinal knobs merge into a single ridge. Finally, inclusions in a ctenoid fish scale lack contrast and are difficult to distinguish when superimposed over the striated body spines (Figure 1(e)). Rotating the specimen to bring the spines parallel to the shear axis (Figure 1(f)) reduces their contrast and renders the inclusions clearly visible.
A number of factors should be considered when adjusting bias retardation to produce optimum specimen contrast. The level of bias that must be introduced to maximally darken one slope or edge of the specimen also yields the maximum possible contrast between the specimen and the background. Therefore, for each specimen, one particular objective prism (or de Sénarmont compensator) setting will usually introduce the greatest degree of contrast. When this value is exceeded, contrast will decrease. Thicker specimens, which often suffer from light scattering artifacts, usually require a larger bias retardation setting (up to a full wavelength) than thinner specimens to obtain extinction in regions having significant phase gradients. Finally, when the iris diaphragm opening size in the condenser exceeds 75 percent of the objective rear aperture, contrast is reduced as a result of excessive light scattering in the optical system. With this difficulty in mind, use caution when opening the condenser aperture to perform optical sectioning experiments.
Contributing Authors
Douglas B. Murphy - Department of Cell Biology and Microscope Facility, Johns Hopkins University School of Medicine, 725 N. Wolfe Street, 107 WBSB, Baltimore, Maryland 21205.
Jan Hinsch - Leica Microsystems, Inc., 110 Commerce Drive, Allendale, New Jersey, 07401.
Matthew J. Parry-Hill and Michael W. Davidson - National High Magnetic Field Laboratory, 1800 East Paul Dirac Dr., The Florida State University, Tallahassee, Florida, 32310.
BACK TO DIFFERENTIAL INTERFERENCE CONTRAST MICROSCOPY