Cholesteric to High Density Phase Transition
|
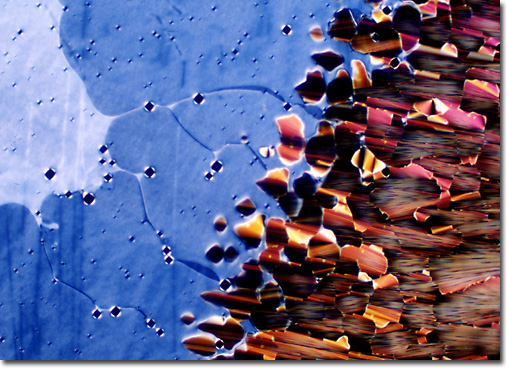
Phase transitions are easily captured in the microscope using "controlled drying" experiments that rely on establishing an increasing concentration gradient of DNA (and salt) across a microscope slide. The photomicrograph above illustrates the cholesteric to high density liquid crystalline DNA phase transition that occurs between 300-450 milligrams per milliliter, depending upon the sodium counterion concentration. The smooth blue textures correspond to cholesteric liquid crystal phase, while the batonnet-focal conic textures are indicative of a high density phase. The DNA concentration for this specimen was initially 100 milligrams per millimeter, but this changes as the solvent evaporates. The magnification is approximately 150x. Originally recorded on Fujichrome 64T transparency film using a Nikon Optiphot-Pol microscope with crossed polarized illumination, the image above was digitized using a Nikon CoolScan transparency film scanner. Exposures were recorded about 2.5 f-steps under the recommended value given by an in-camera photomultiplier and were push-processed approximately 1.5 f-steps in the first E-6 developer. |
© 1995-2025 by Michael W. Davidson and The Florida State University. All Rights Reserved. No images, graphics, software, scripts, or applets may be reproduced or used in any manner without permission from the copyright holders. Use of this website means you agree to all of the Legal Terms and Conditions set forth by the owners.
This website is maintained by our
|